Context is Key: Know Where Bond Markets Stand and How They Are Trending
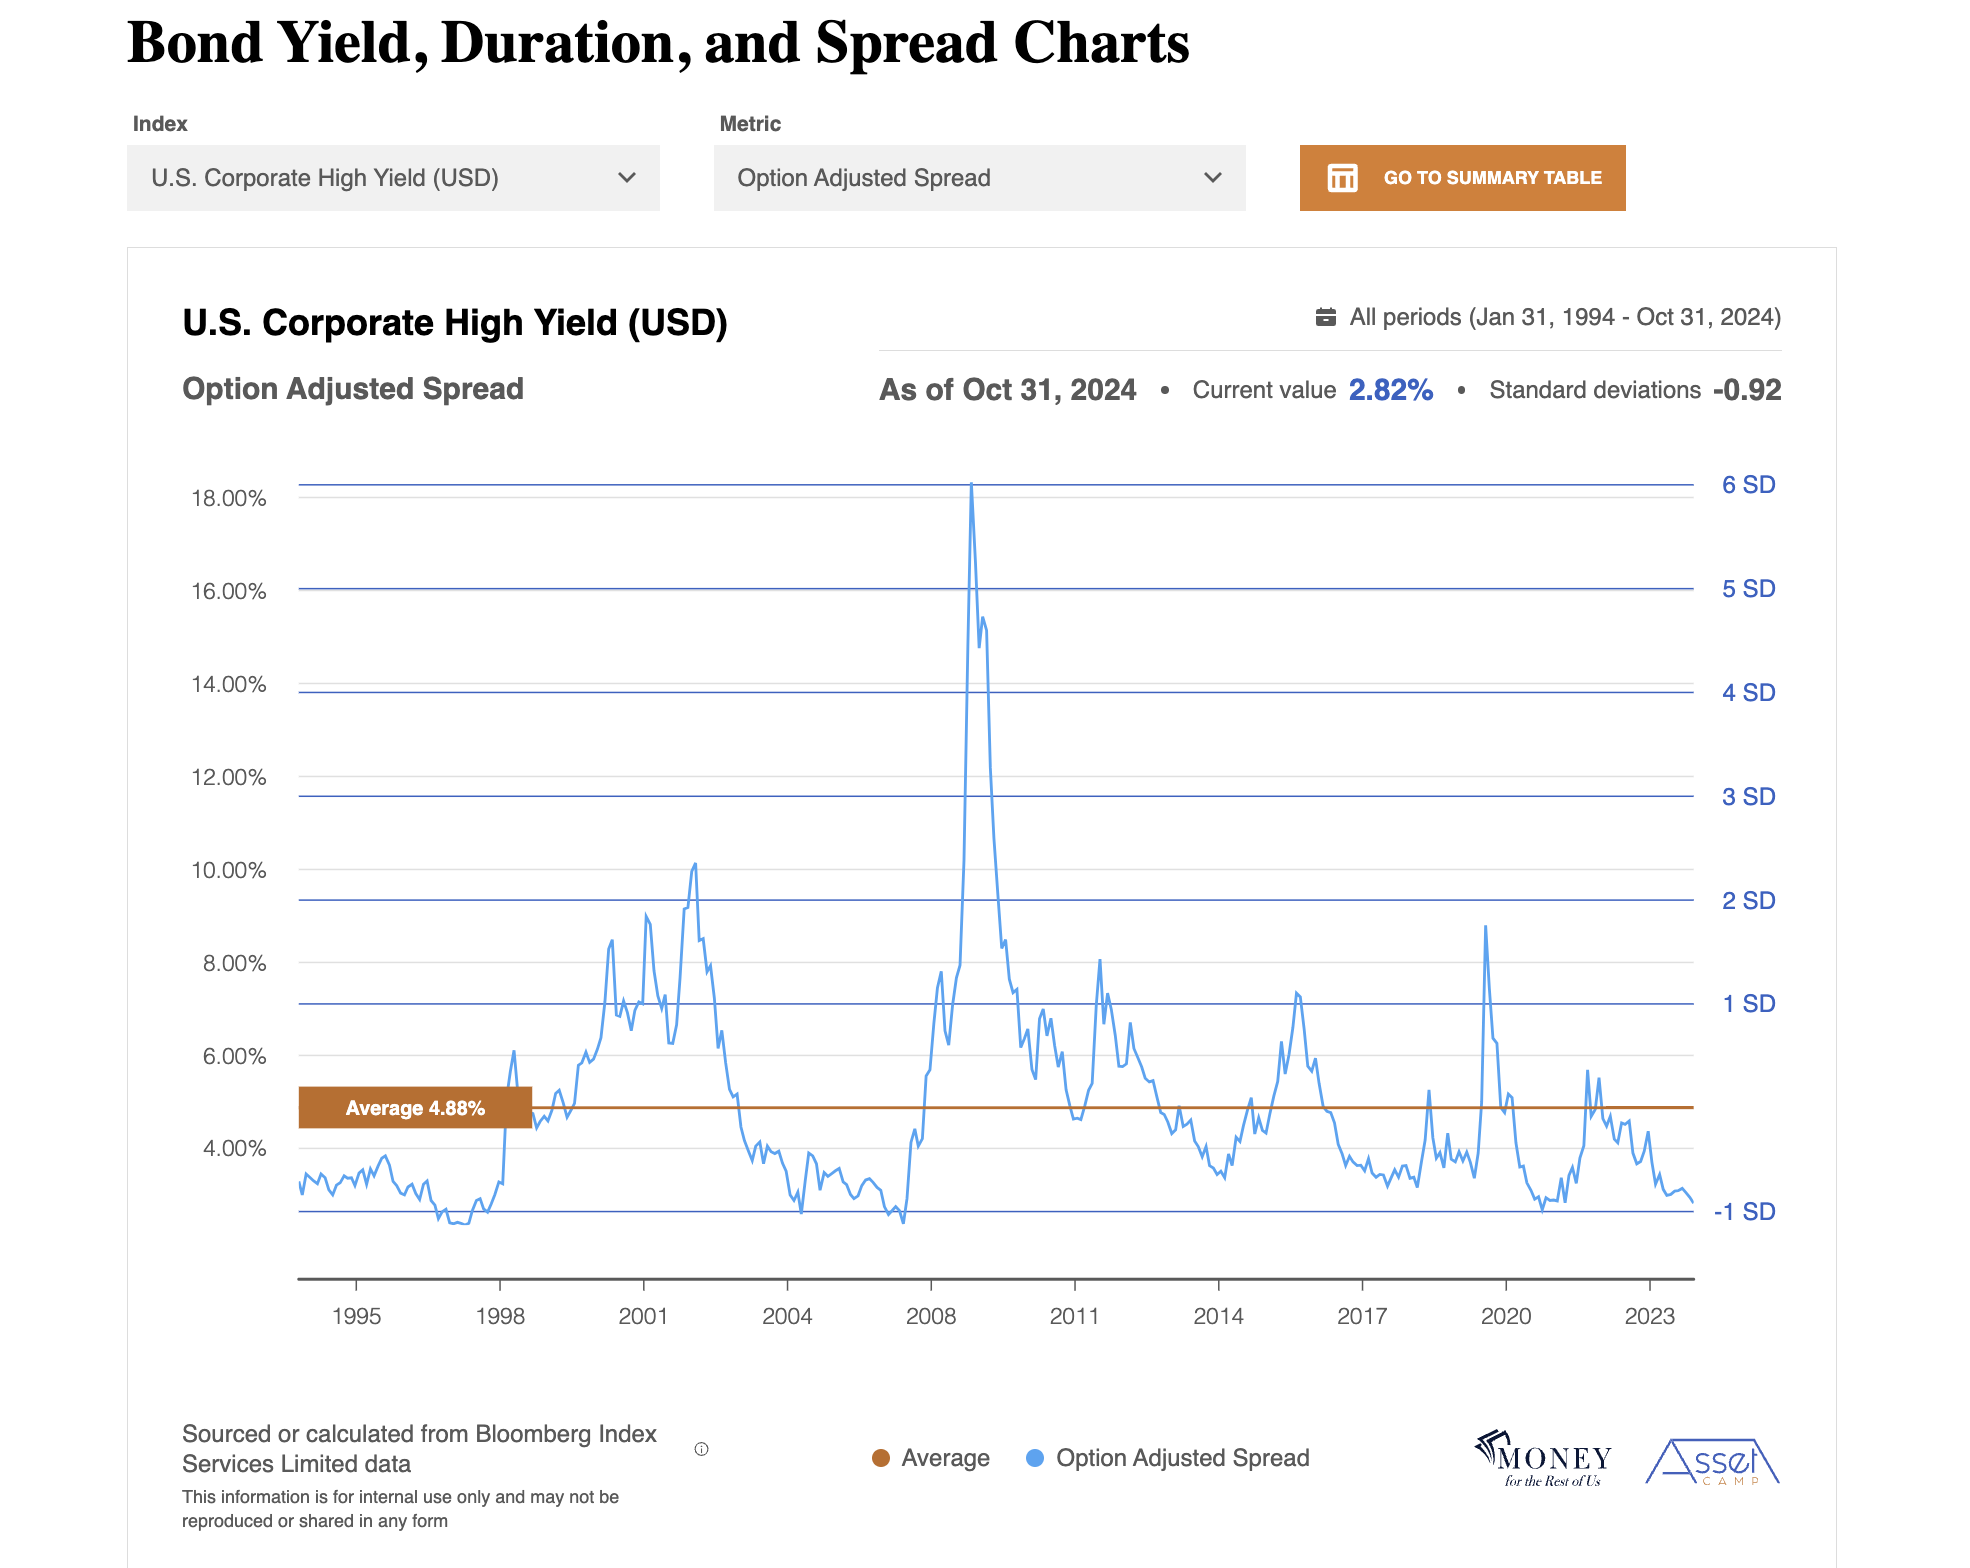
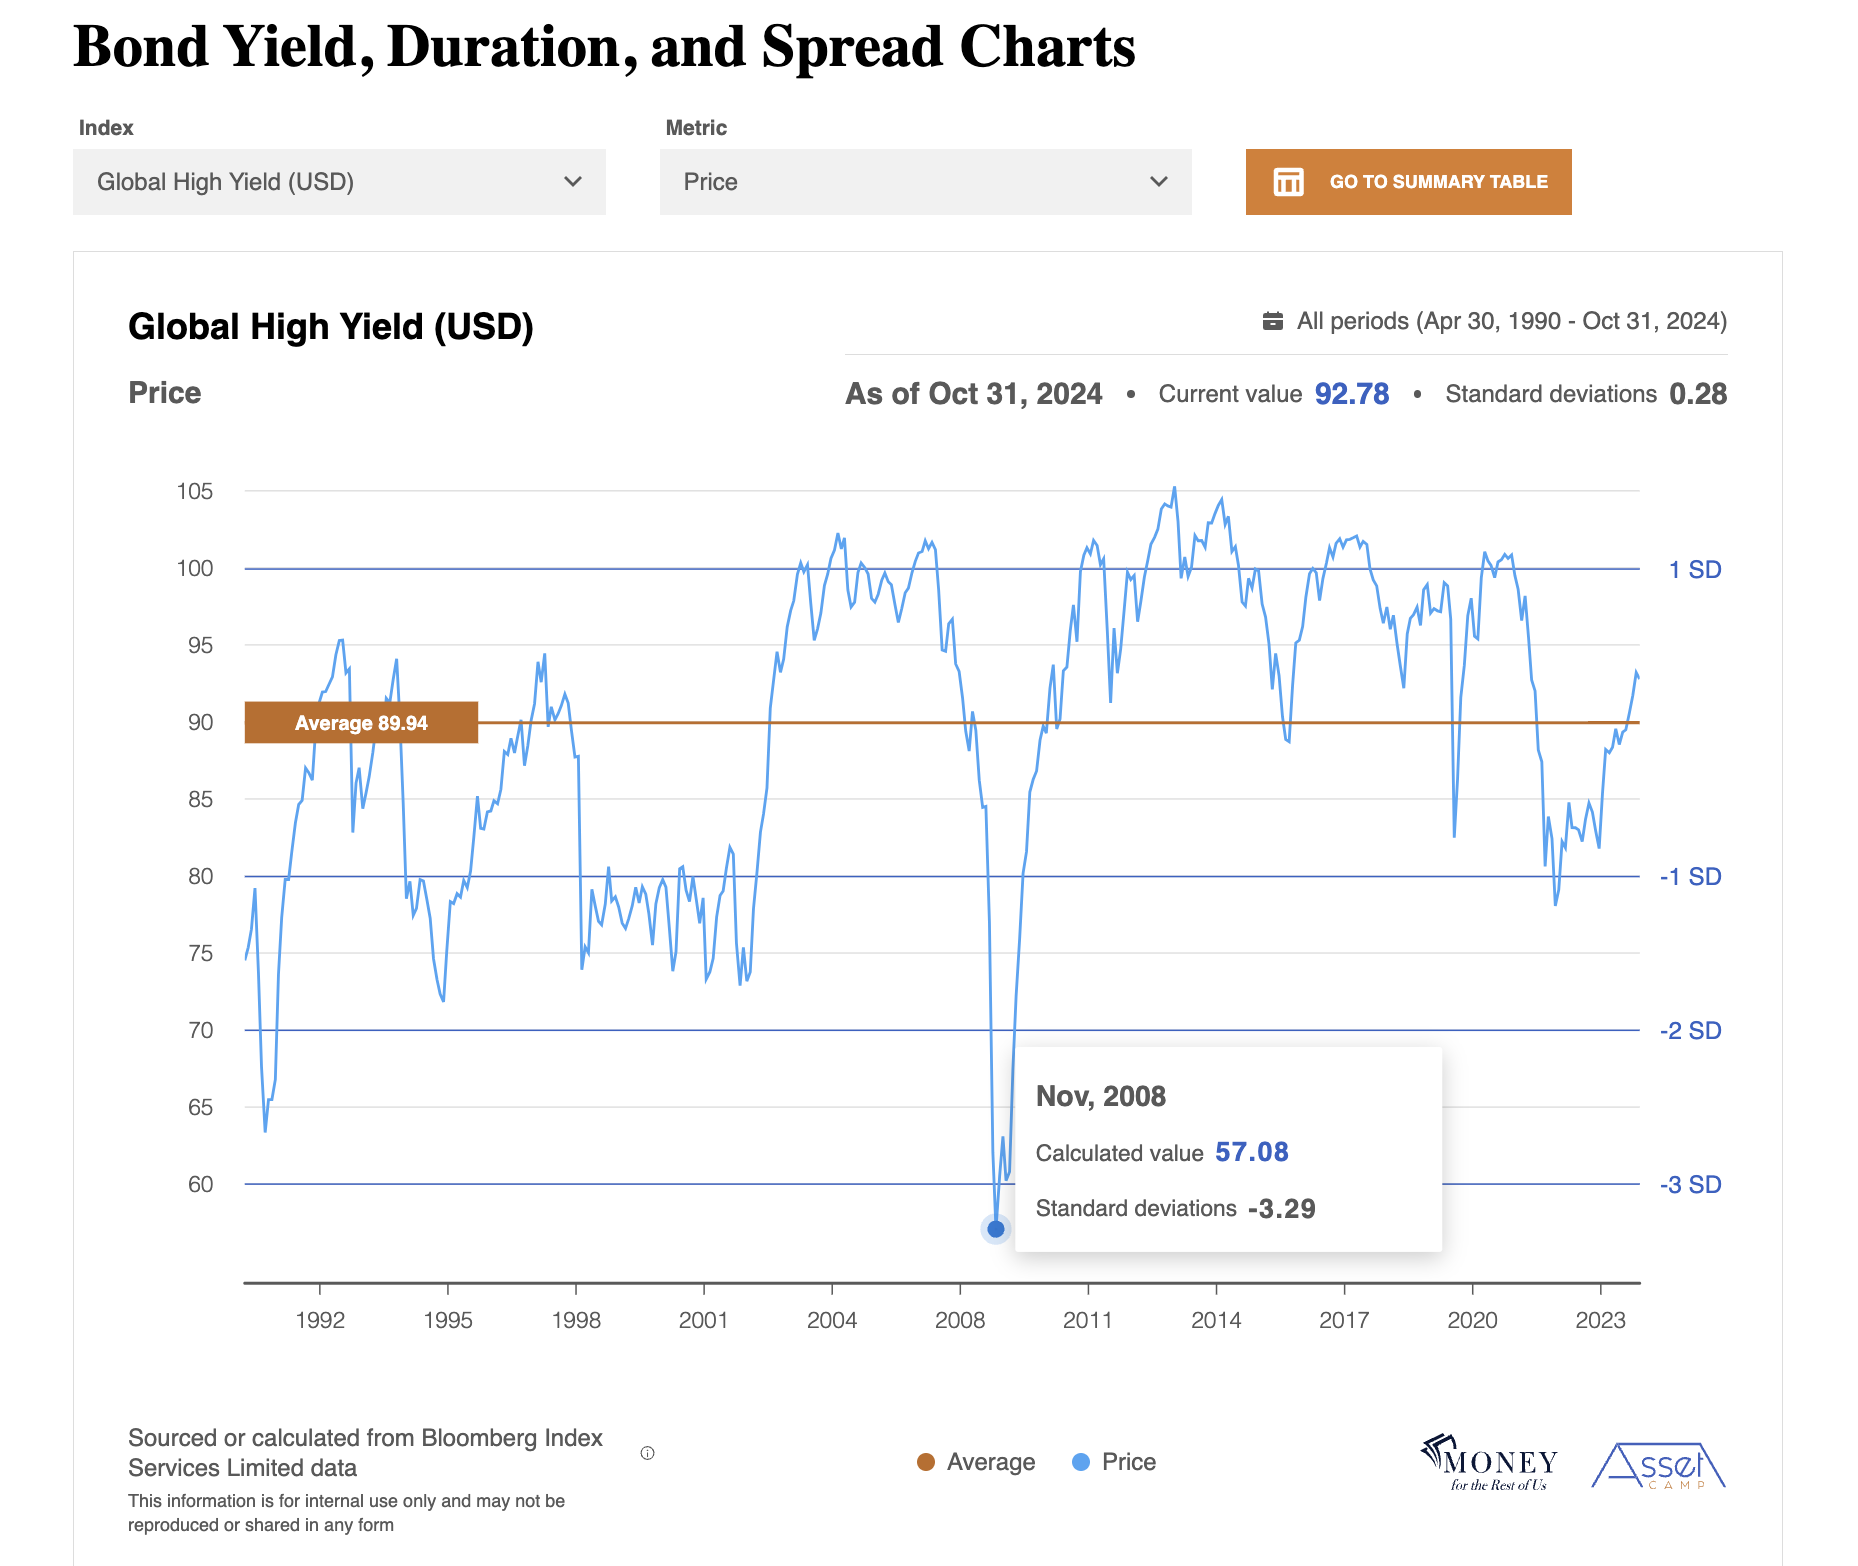
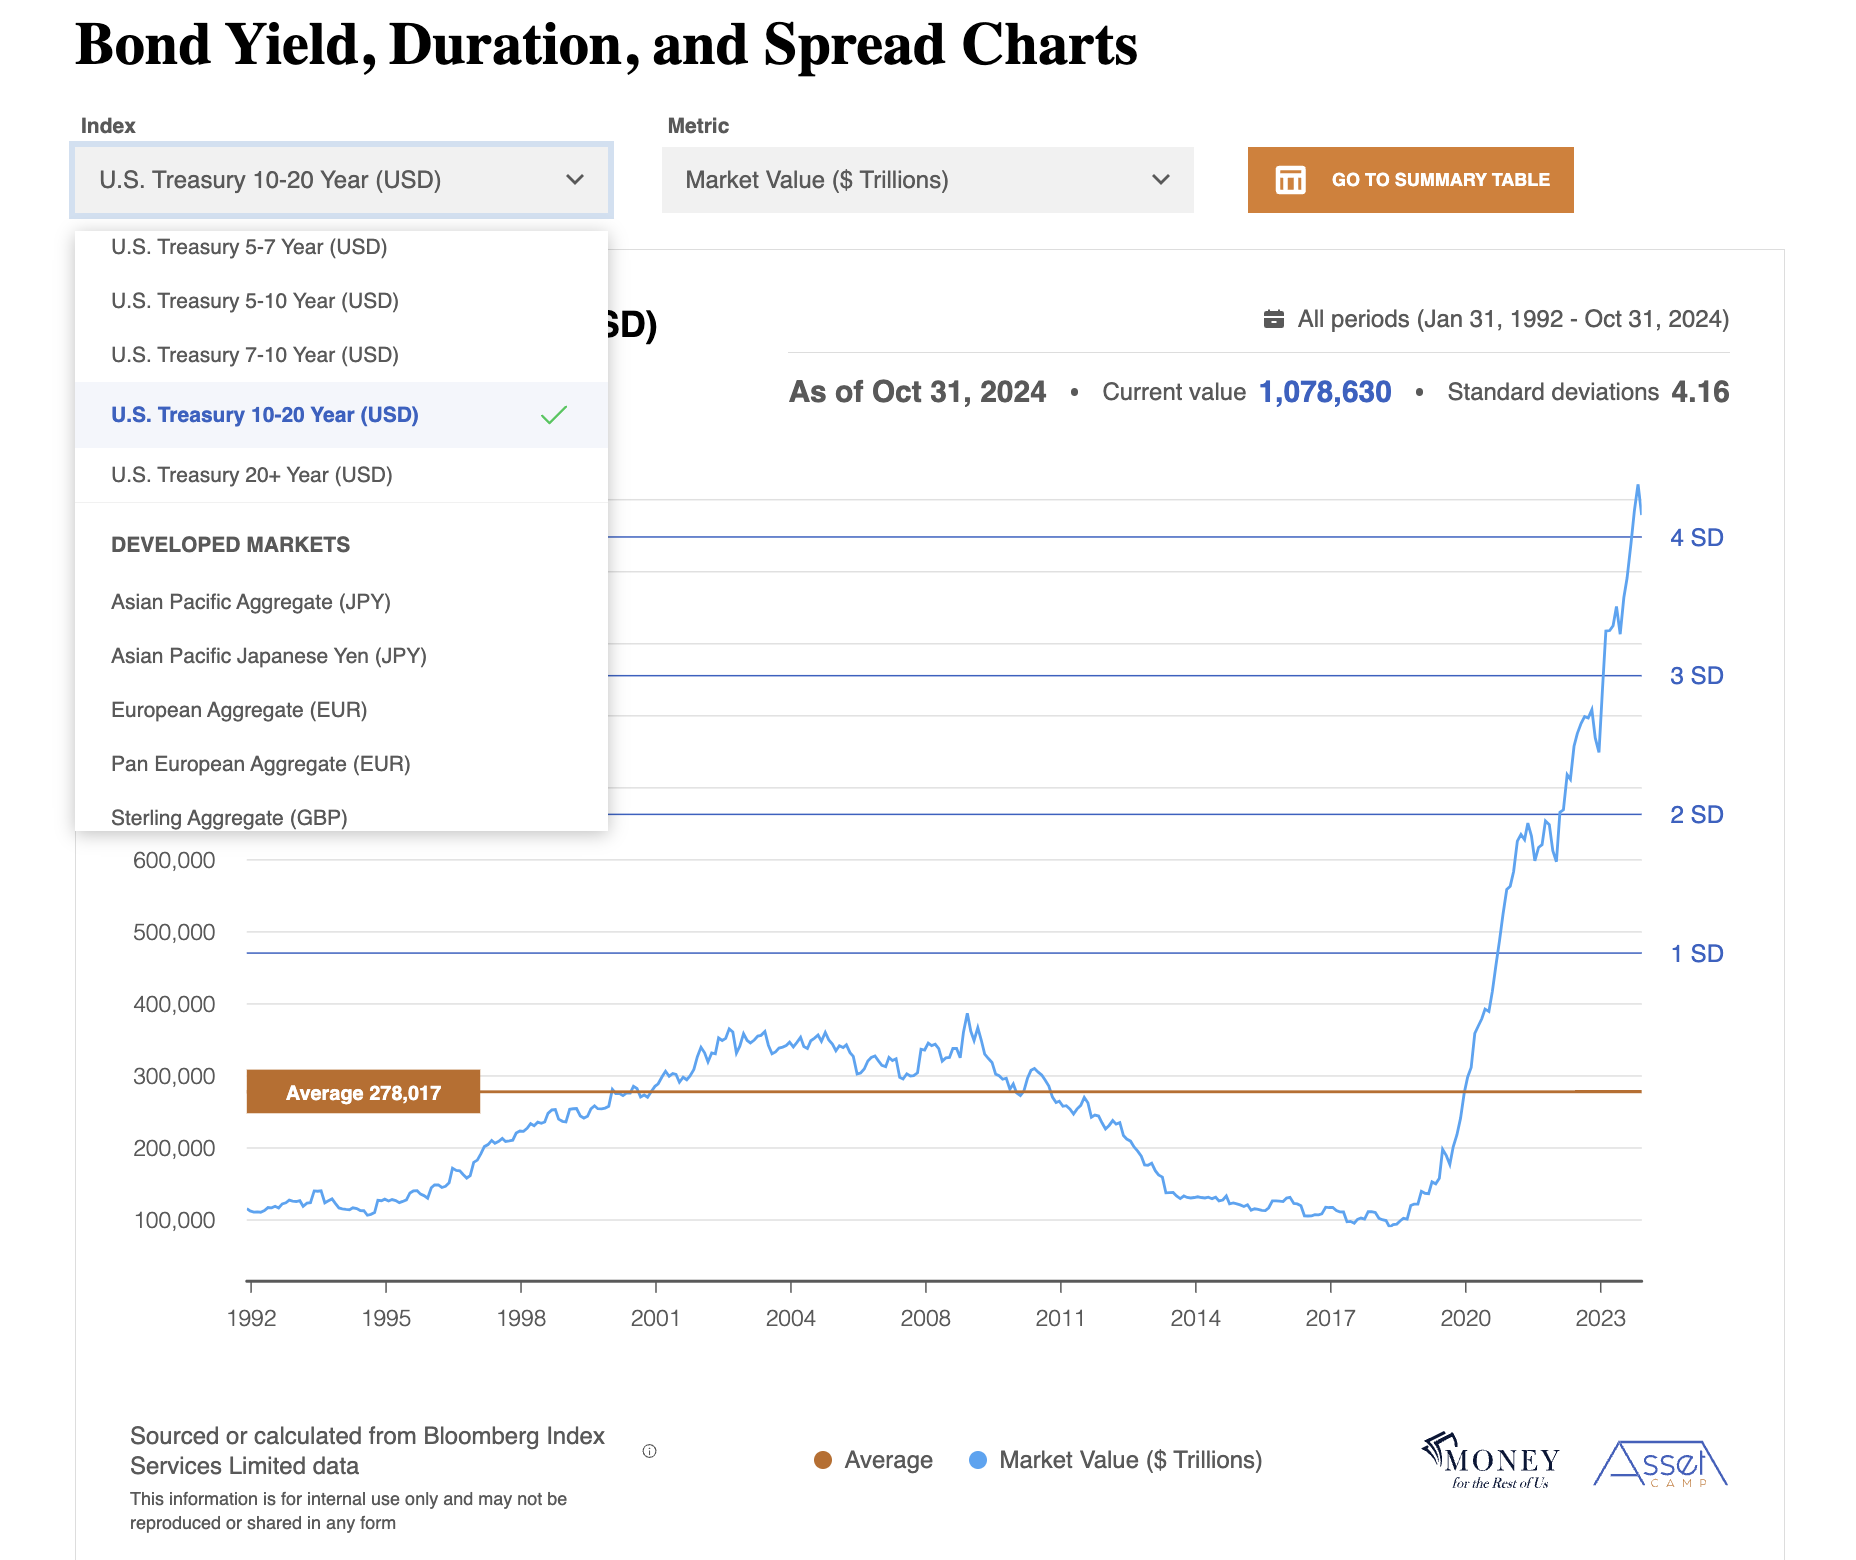
Asset Camp’s Bond Yield, Duration, and Spread Charts are the kind of information previously only available to professional investors and fund managers. You can chart all 28 of our bond indexes across 11 different market metrics. That’s over 300 charts at your disposal to check your work and gain powerful investing insights.

Historical and Current Context
Confidently grasp how now compares to then. No more decisions based on gut feelings or guesswork.
Over or Under Valued?
Compare current bond market metrics, including which areas of the bond market offer the most attractive yields or whether corporate spreads are wider or narrower than average. Quickly assess new opportunities or looming risks for your portfolio. No more guessing; you can check your work.
Authoritative Understanding
Yield, Duration, and Spread Charting is part of the proven investing framework used by professional asset managers, including hedge funds. Now you can unlock this key aspect of wealth building and management.
Size and Quality
Market Value (Trillions)
Number of Issues
Average Credit Quality
Price, Yield, and Spread
Average Coupon
Yield to Maturity
Price
Option Adjusted Spread
Interest Rate Sensitivity
Average Maturity (Years)
Modified Duration
Duration to Worst
Convexity
11 Essential Metrics
Empower your investing like never before with 11 key bond market metrics, including size, quality, price, and interest rate sensitivity measurements.

Current and Historical View
Isolate a bond market metric at any point in time. See how right now compares to the long-term average and confidently make decisions about investment opportunities and risk.

Chart Your Way Across the Market
We have charts for each of our bond indexes, based on data going back to the index’s inception date, giving you the most comprehensive snapshot of index performance ever available to individual investors.
Ready to take your next step?
Act on the same data as the professionals.

