Get a Clear View of the Investment Markets with Straightforward Tables and Charts
Built on top-tier data from MSCI, Bloomberg, and I/B/E/S, Asset Camp has powerful, index-focused investing research tools that answer what happened and where we are now when it comes to stock and bond markets.
What Happened?—Historical Data Tools
Stop making decisions without context. Confidently know and explain the ins and outs of stock and bond performance and what drove it.
Historical Stock Market Tools
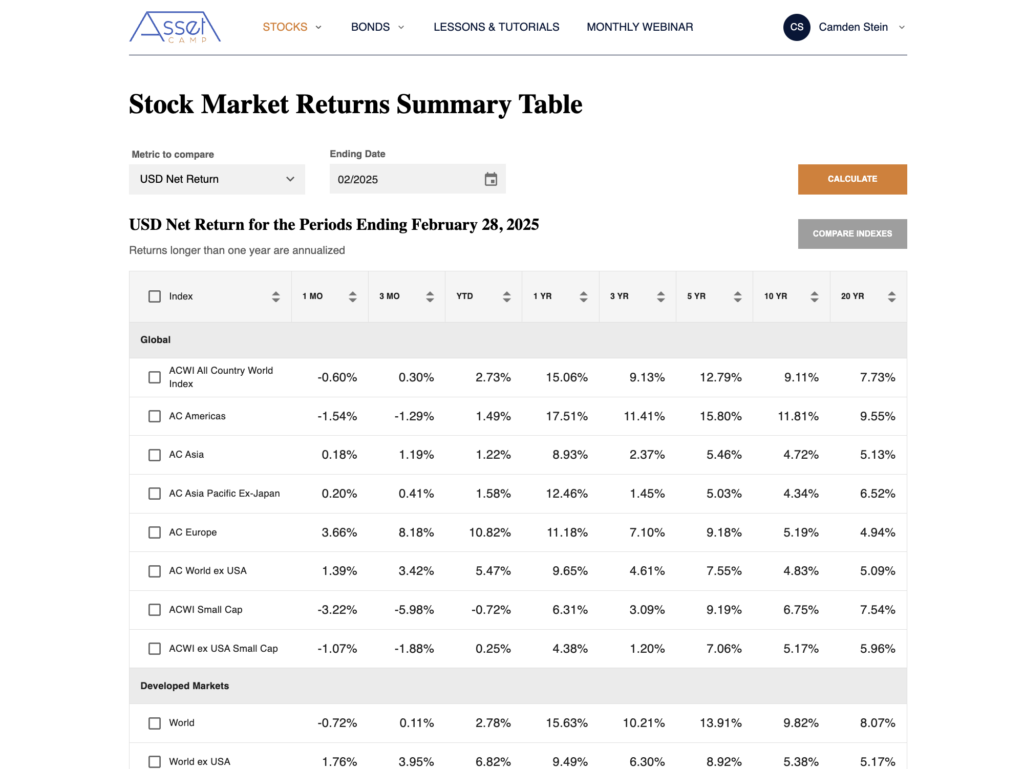
Stock Return Summary Tables
Quickly see the big picture of the stock market: compare and rank our 46 stock indexes by short-term and long-term performance using various return types and standardized time periods.
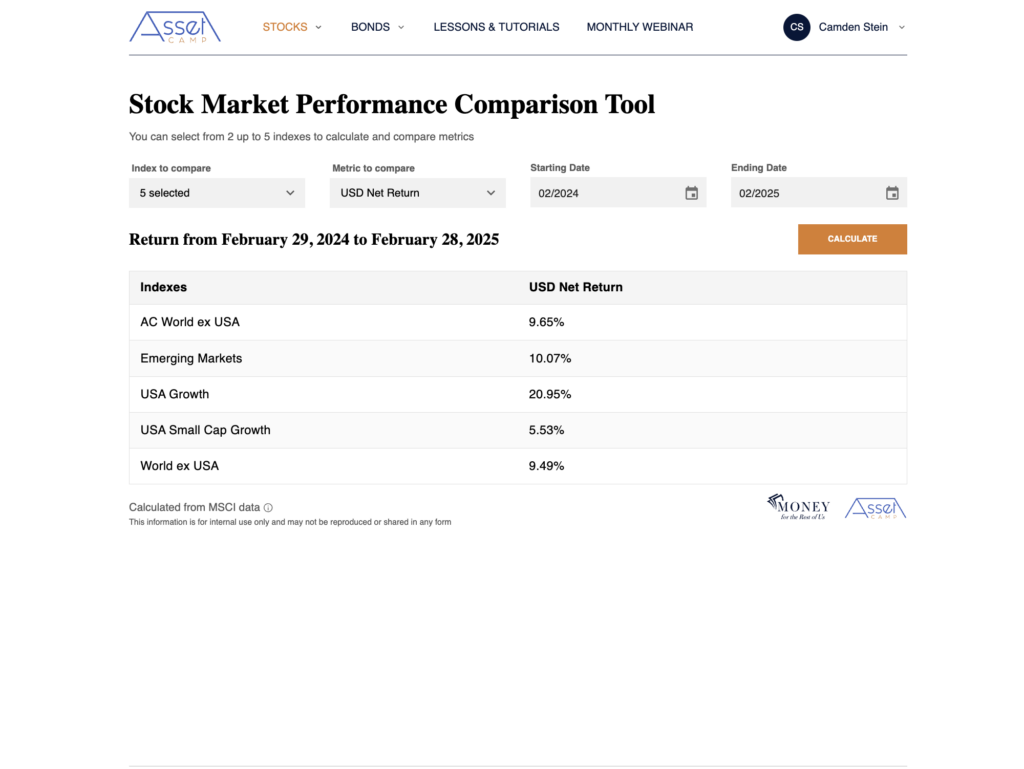
Stock Performance Comparison Tools
Get deeper, long-term insight by comparing the performance of up to five selected stock indexes across any custom time period for which the data is available. You get to pick what matters most to you.
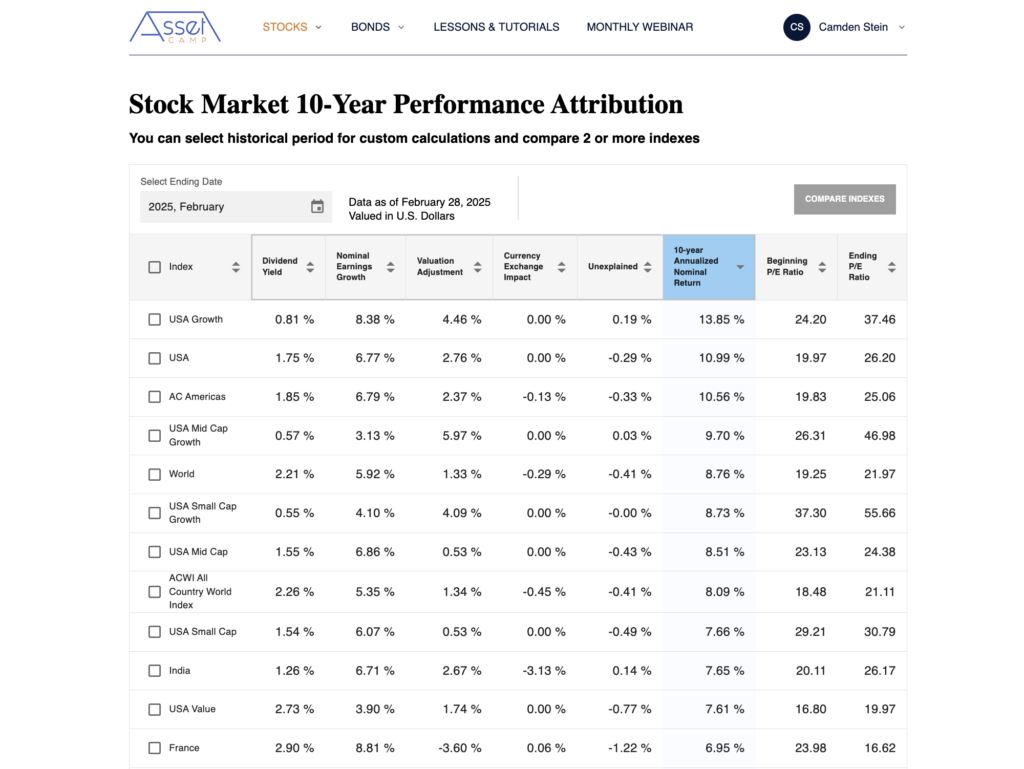
Stock Market 10-Year Performance Attribution
Demystify over- and under-performance by breaking down the primary drivers of stock market performance for each index: dividend yield, earnings per share growth, valuation changes, and currency impact.
Historical Bond Market Tools
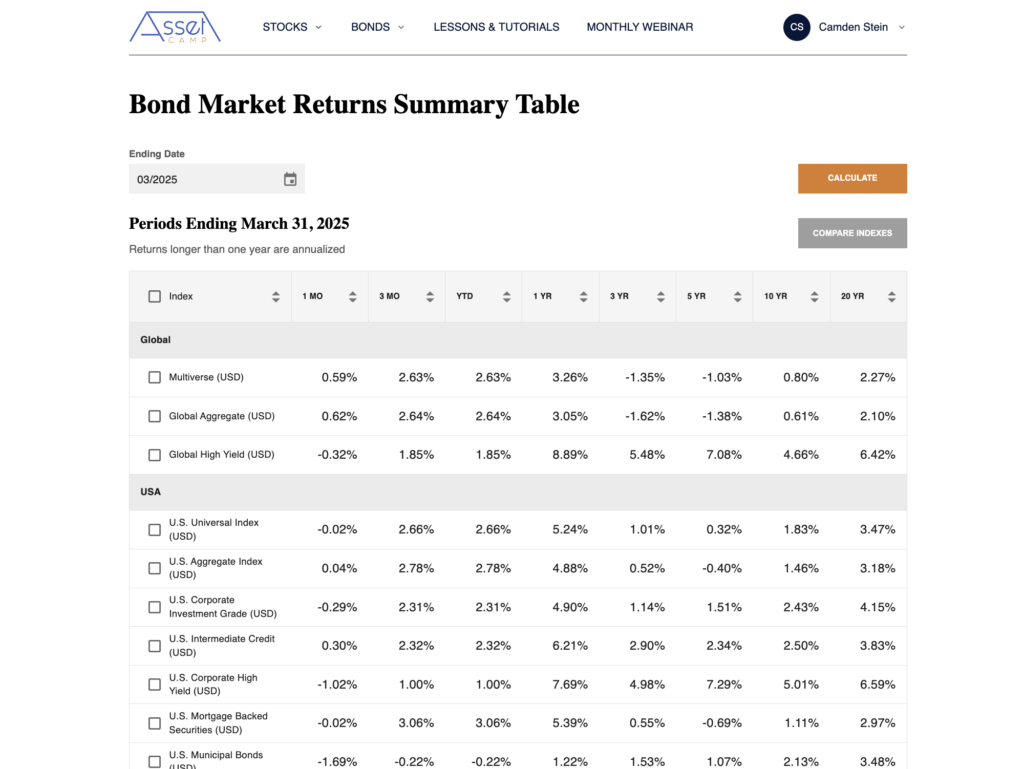
Bond Return Summary Table
Don’t wonder about your bond holdings. Compare and rank our 28 bond indexes by short-term and long-term performance using standardized time periods.
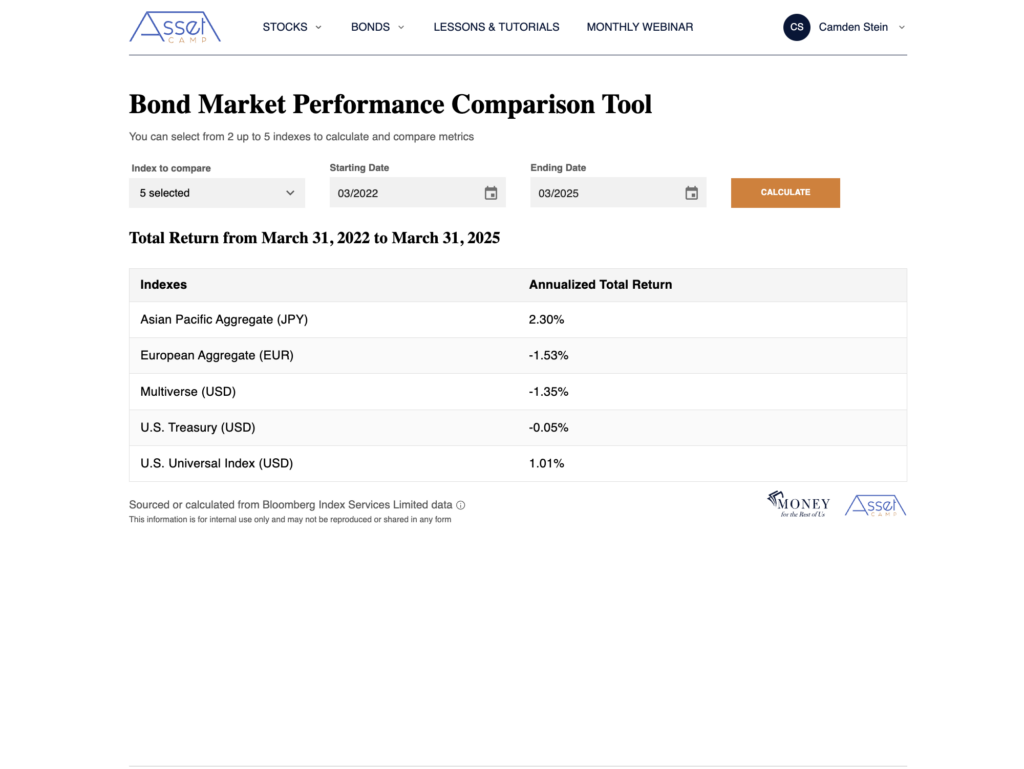
Bond Performance Comparison Tool
Get deeper confidence with deeper bond insights: Compare the performance of up to five selected bond indexes across any time period for which the data is available.
Where Are We Now?—Current Trend and Valuation Tools
You don’t need to wonder which way the market is moving. Asset Camp’s comprehensive tables and charts lay out the current investing market like never before.
Current Trends: Stock Market Tools
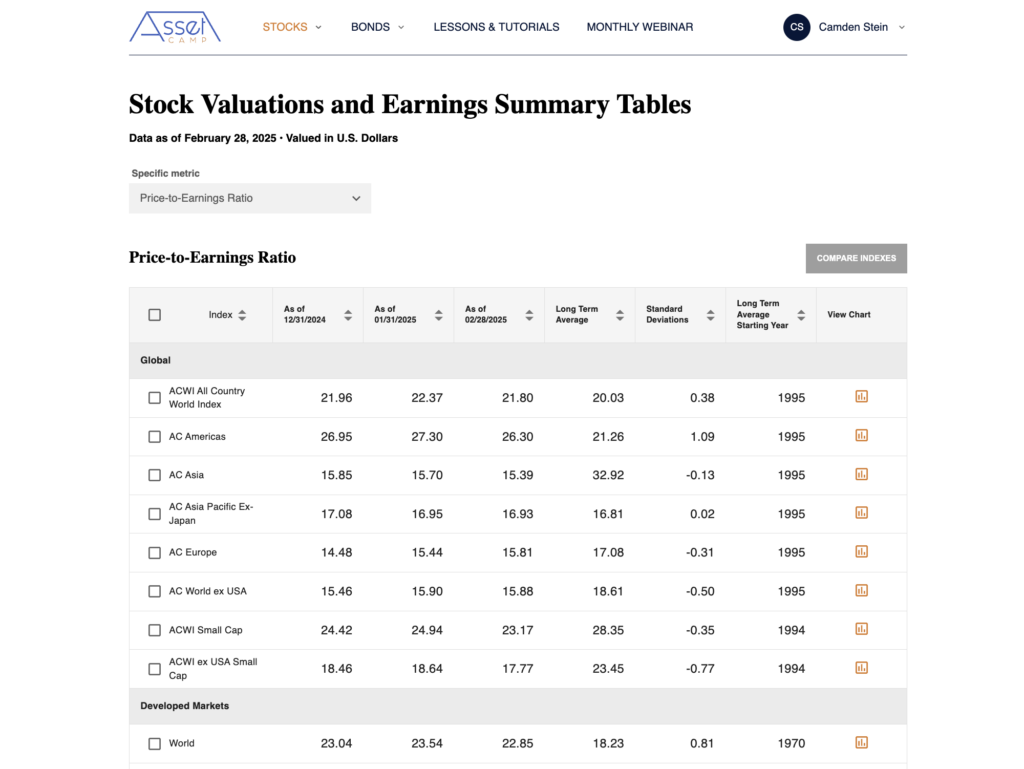
Stock Valuations and Earnings Summary Table
Quickly compare valuation and earnings metrics across all 46 of our stock indexes. Easily see data for the last three months, the long-term average, and how much the current metric differs from the long-term average across all the fundamentals of dividends, earnings, and valuations.
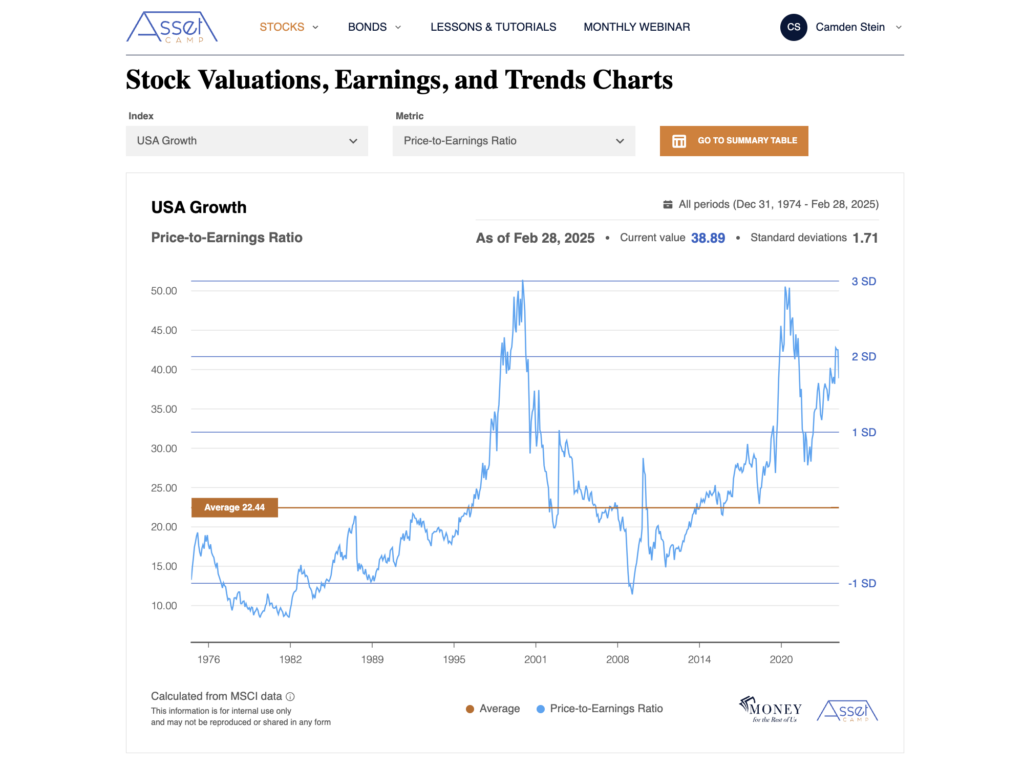
Stock Valuations, Earnings, and Trends Charts
Quickly assess new opportunities or looming risks with powerful visuals: chart all 46 of our metrics across 21 different market metrics, including ten valuation views, six earnings views, four trend views, and more.
Current Trends: Bond Market Tools
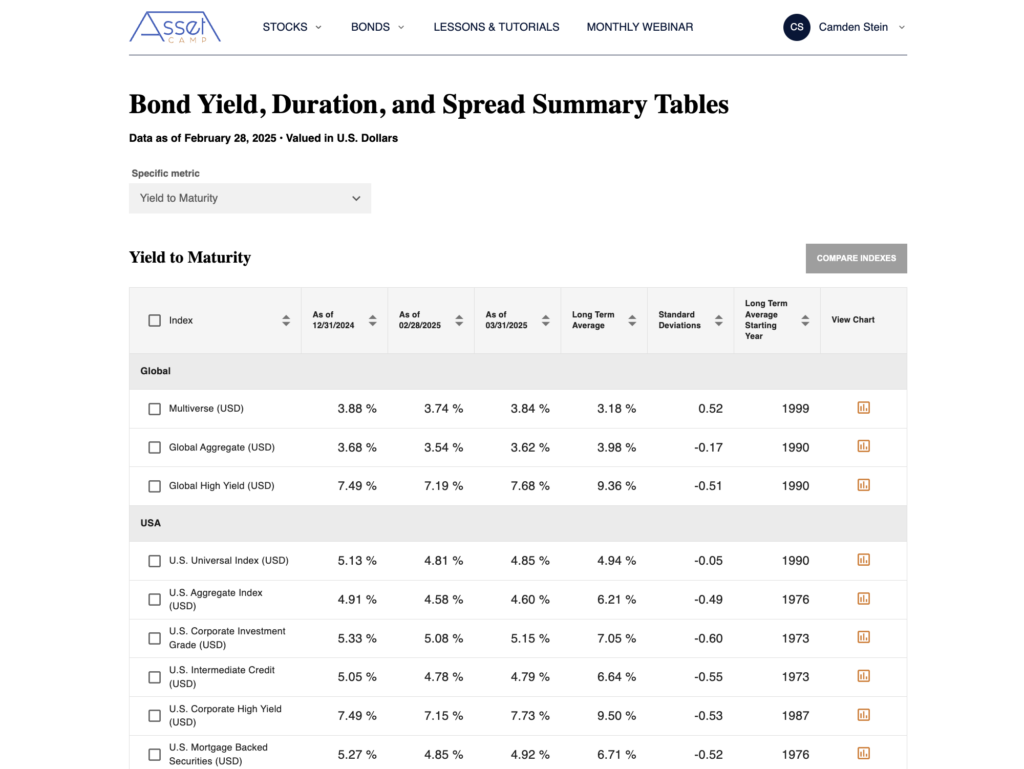
Bond Yield, Duration, and Spread Summary Tables
Compare size, quality, price, yield, spread, and rate sensitivity across all 28 bond indexes over the past 3 months. See long-term averages, current deviations, and which bond sectors—short or long-term, corporate, mortgage, or government—offer the most attractive yields.
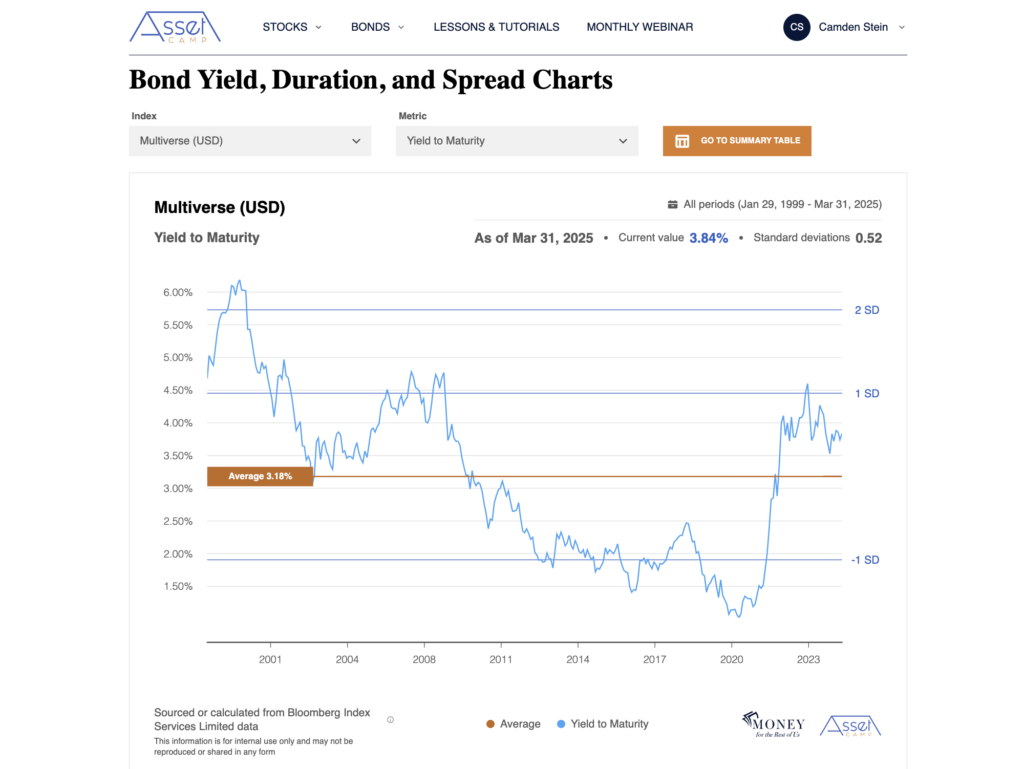
Bond Yield, Duration, and Spread Charts
Build confidence with clear visuals: Chart all 28 bond indexes across 11 key metrics—like size, quality, price, and rate sensitivity. Spot opportunities or risks fast, from attractive yields to unusually wide or narrow corporate spreads.
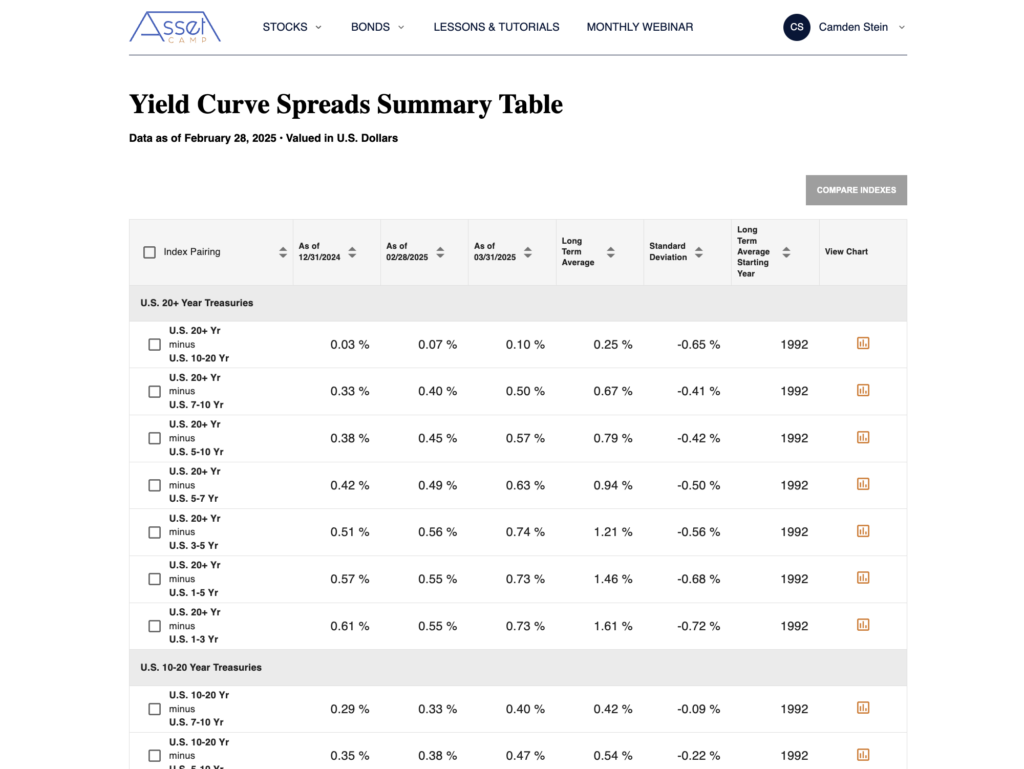
Yield Curve Spreads Summary Tables
Compare long and short-term U.S. Treasury yields to evaluate income opportunities, monitor recession risk, and time duration shifts. Spot inverted yield curves, track historical spread norms, and use standard deviation insights to assess when longer-term bonds offer a compelling advantage or when shorter-term bonds may be more attractive.
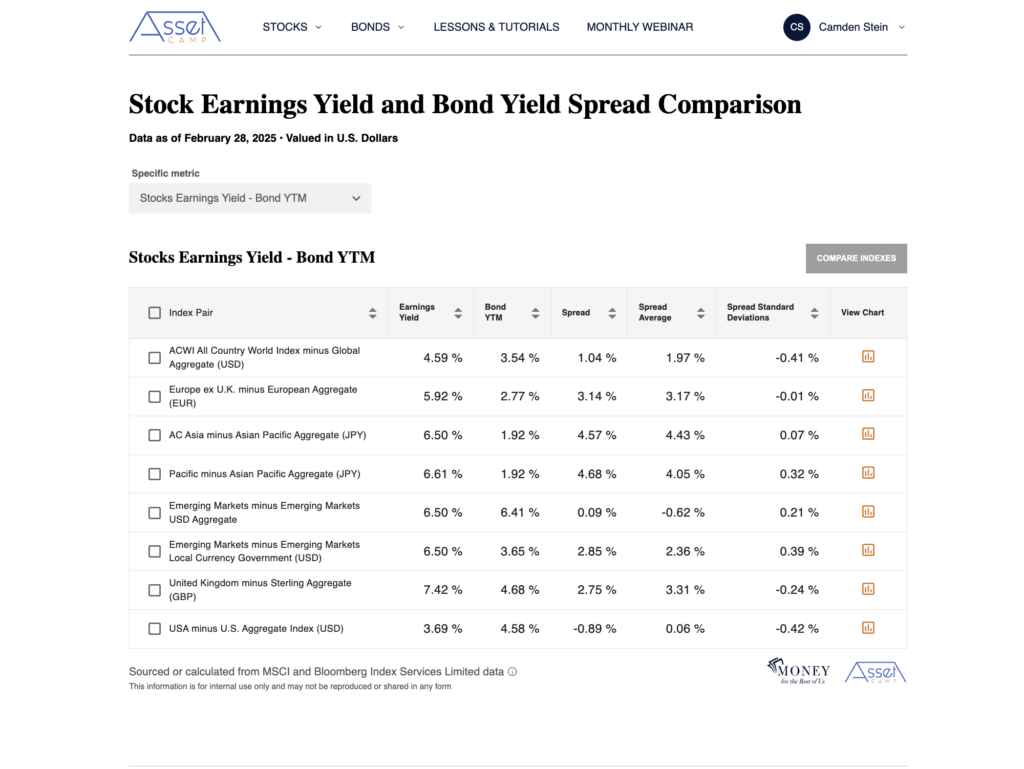
Stock Earnings Yield and Bond Yield Spread Comparison
Compare stock vs. bond yields across eight regions to understand relative valuations, identify shifts in market attractiveness, and support smarter portfolio adjustments. See which regions have historically favored stocks or bonds, spot unusually wide or narrow yield spreads, and use these insights to guide long-term asset allocation across life stages.