Deeper Insights, Faster
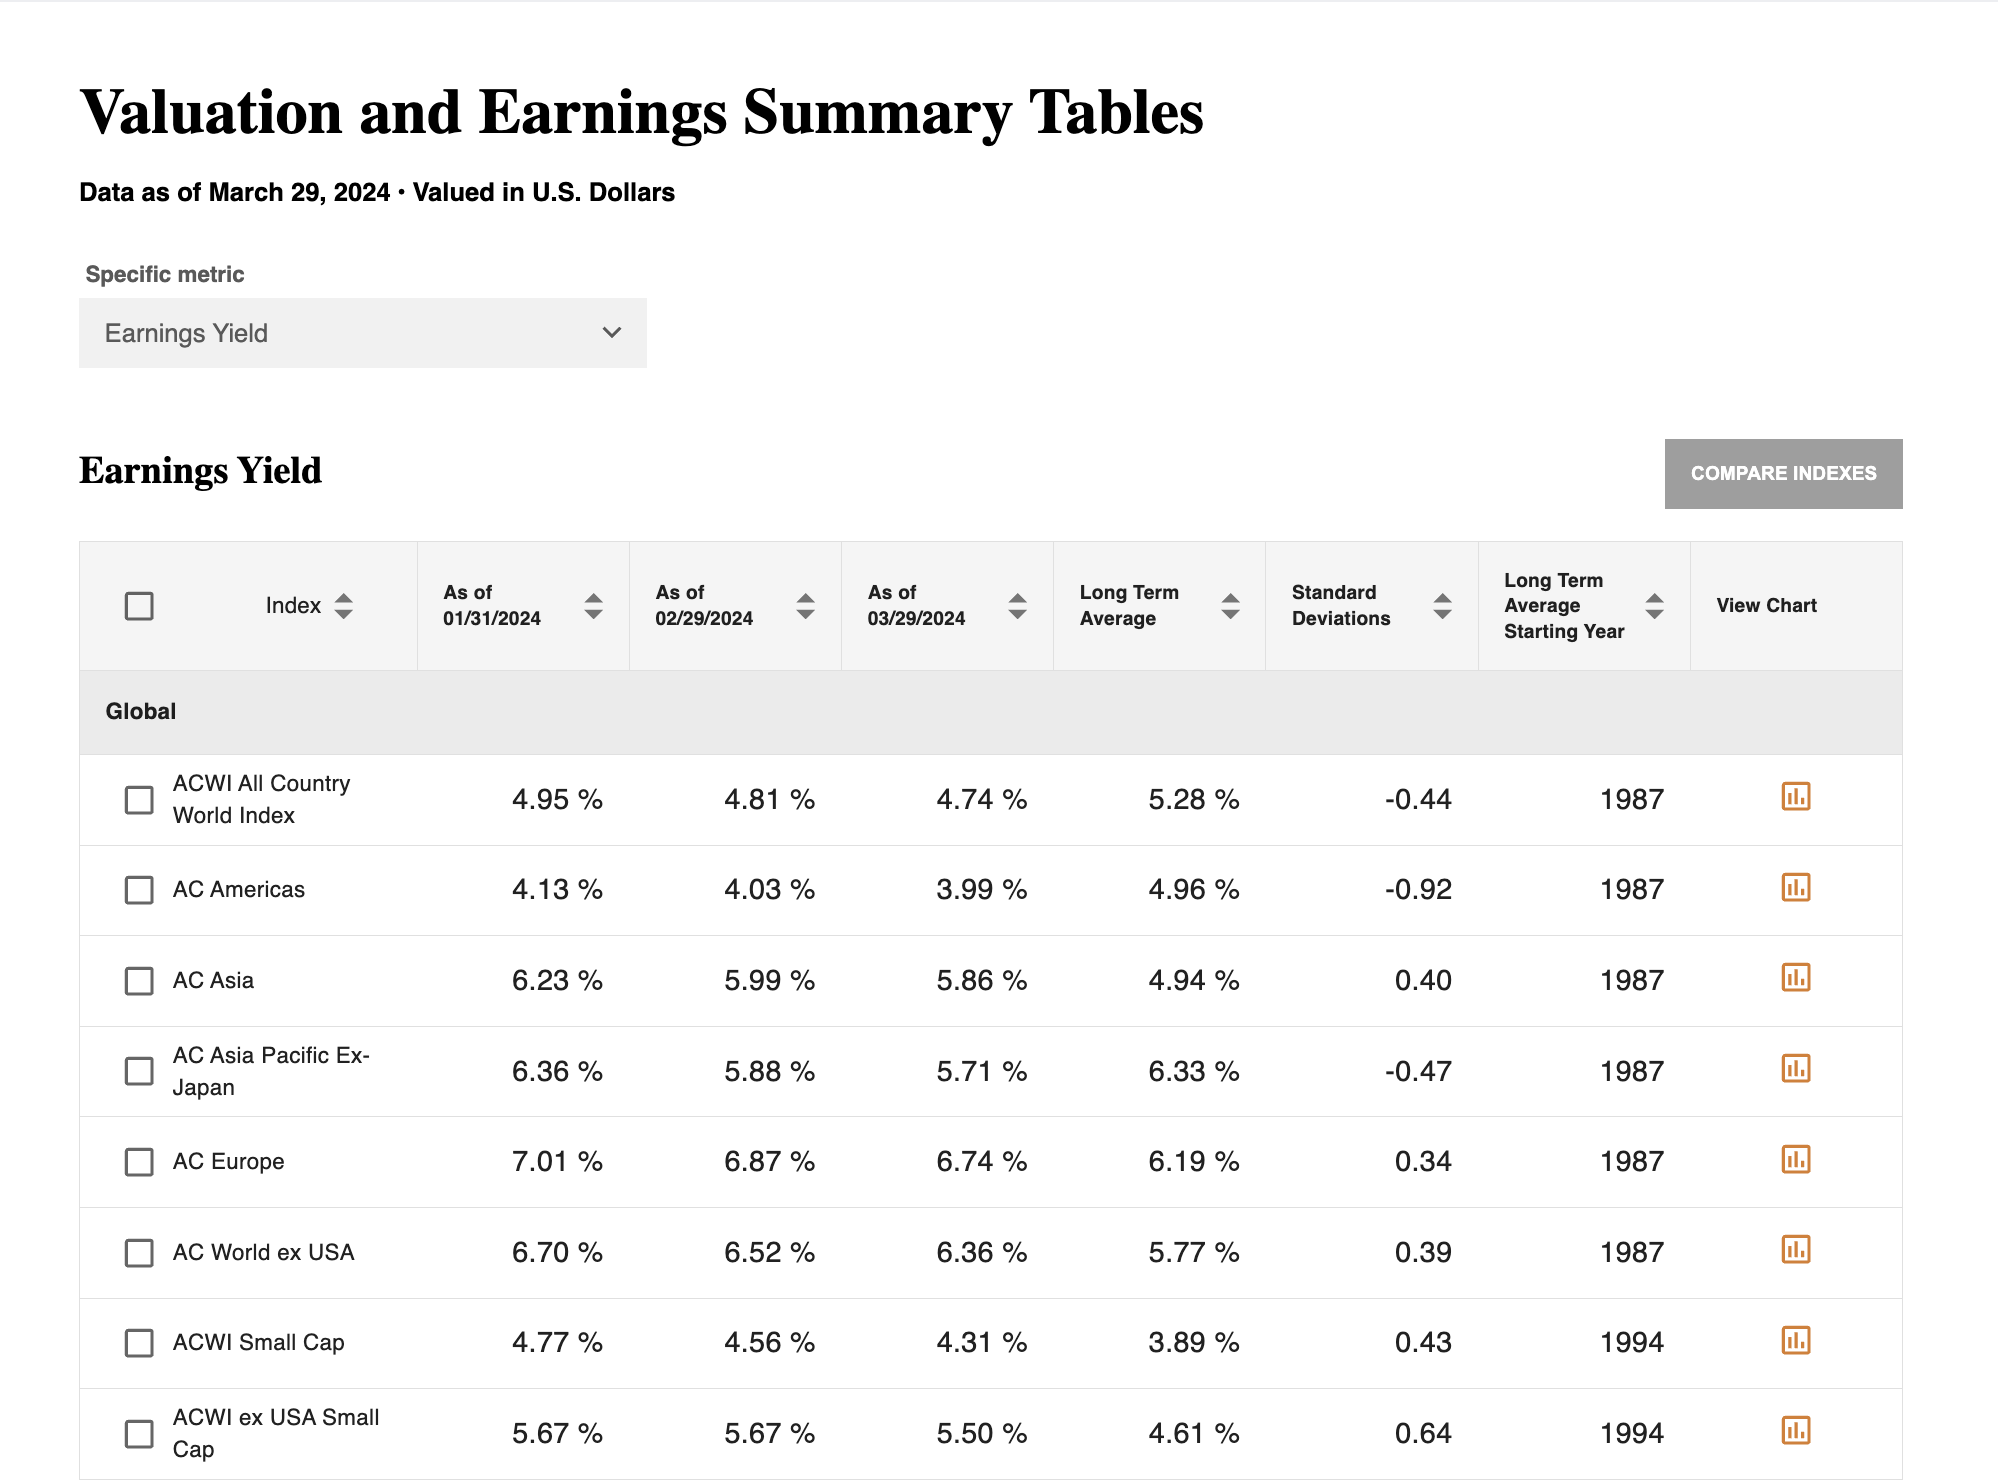
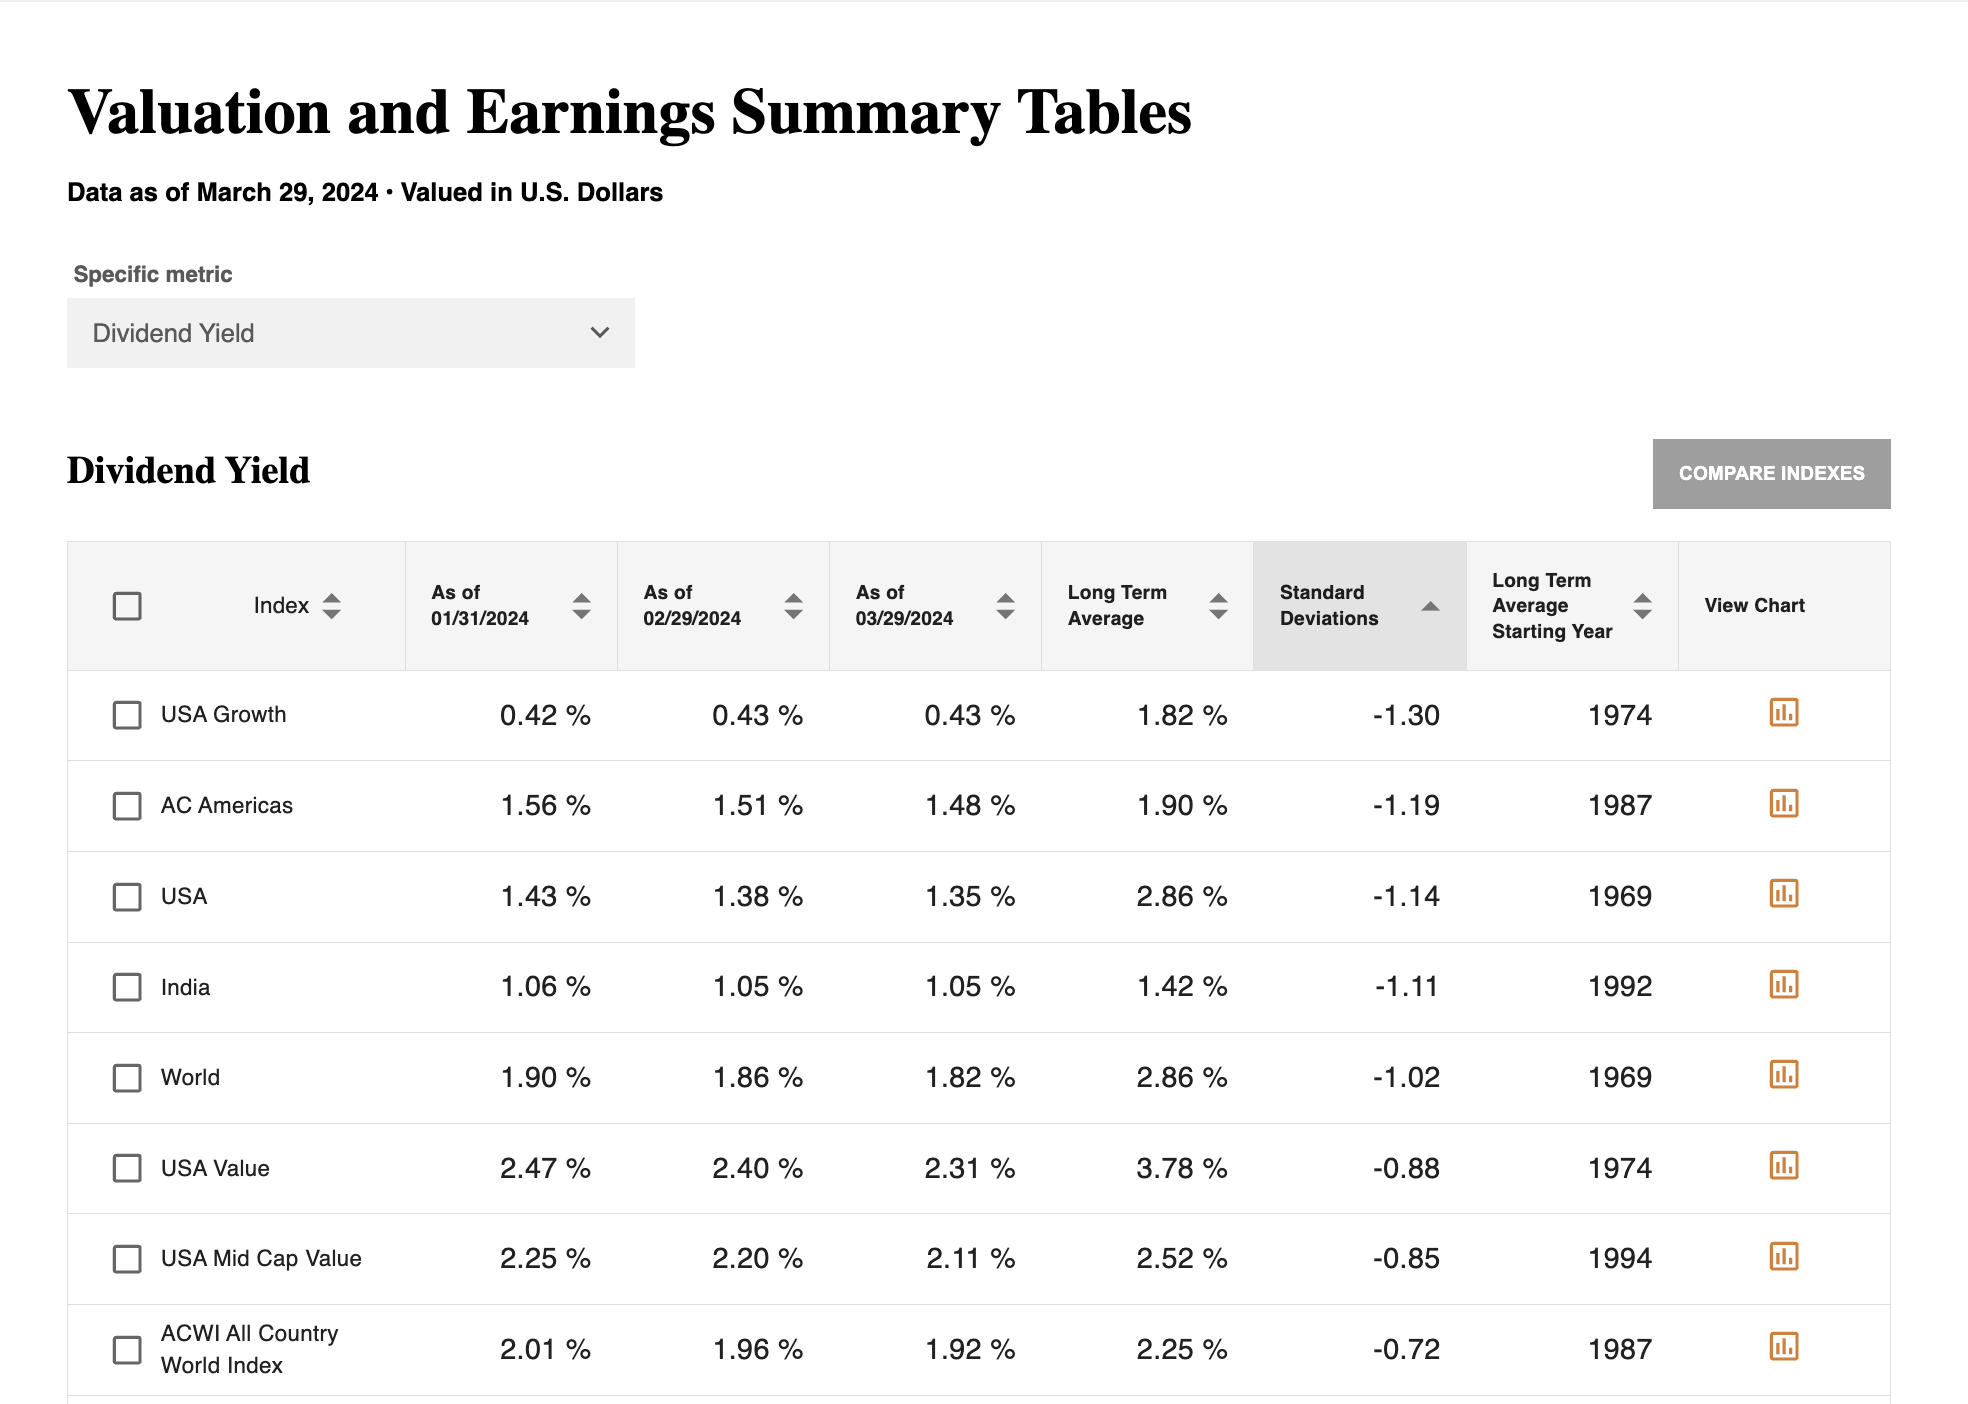
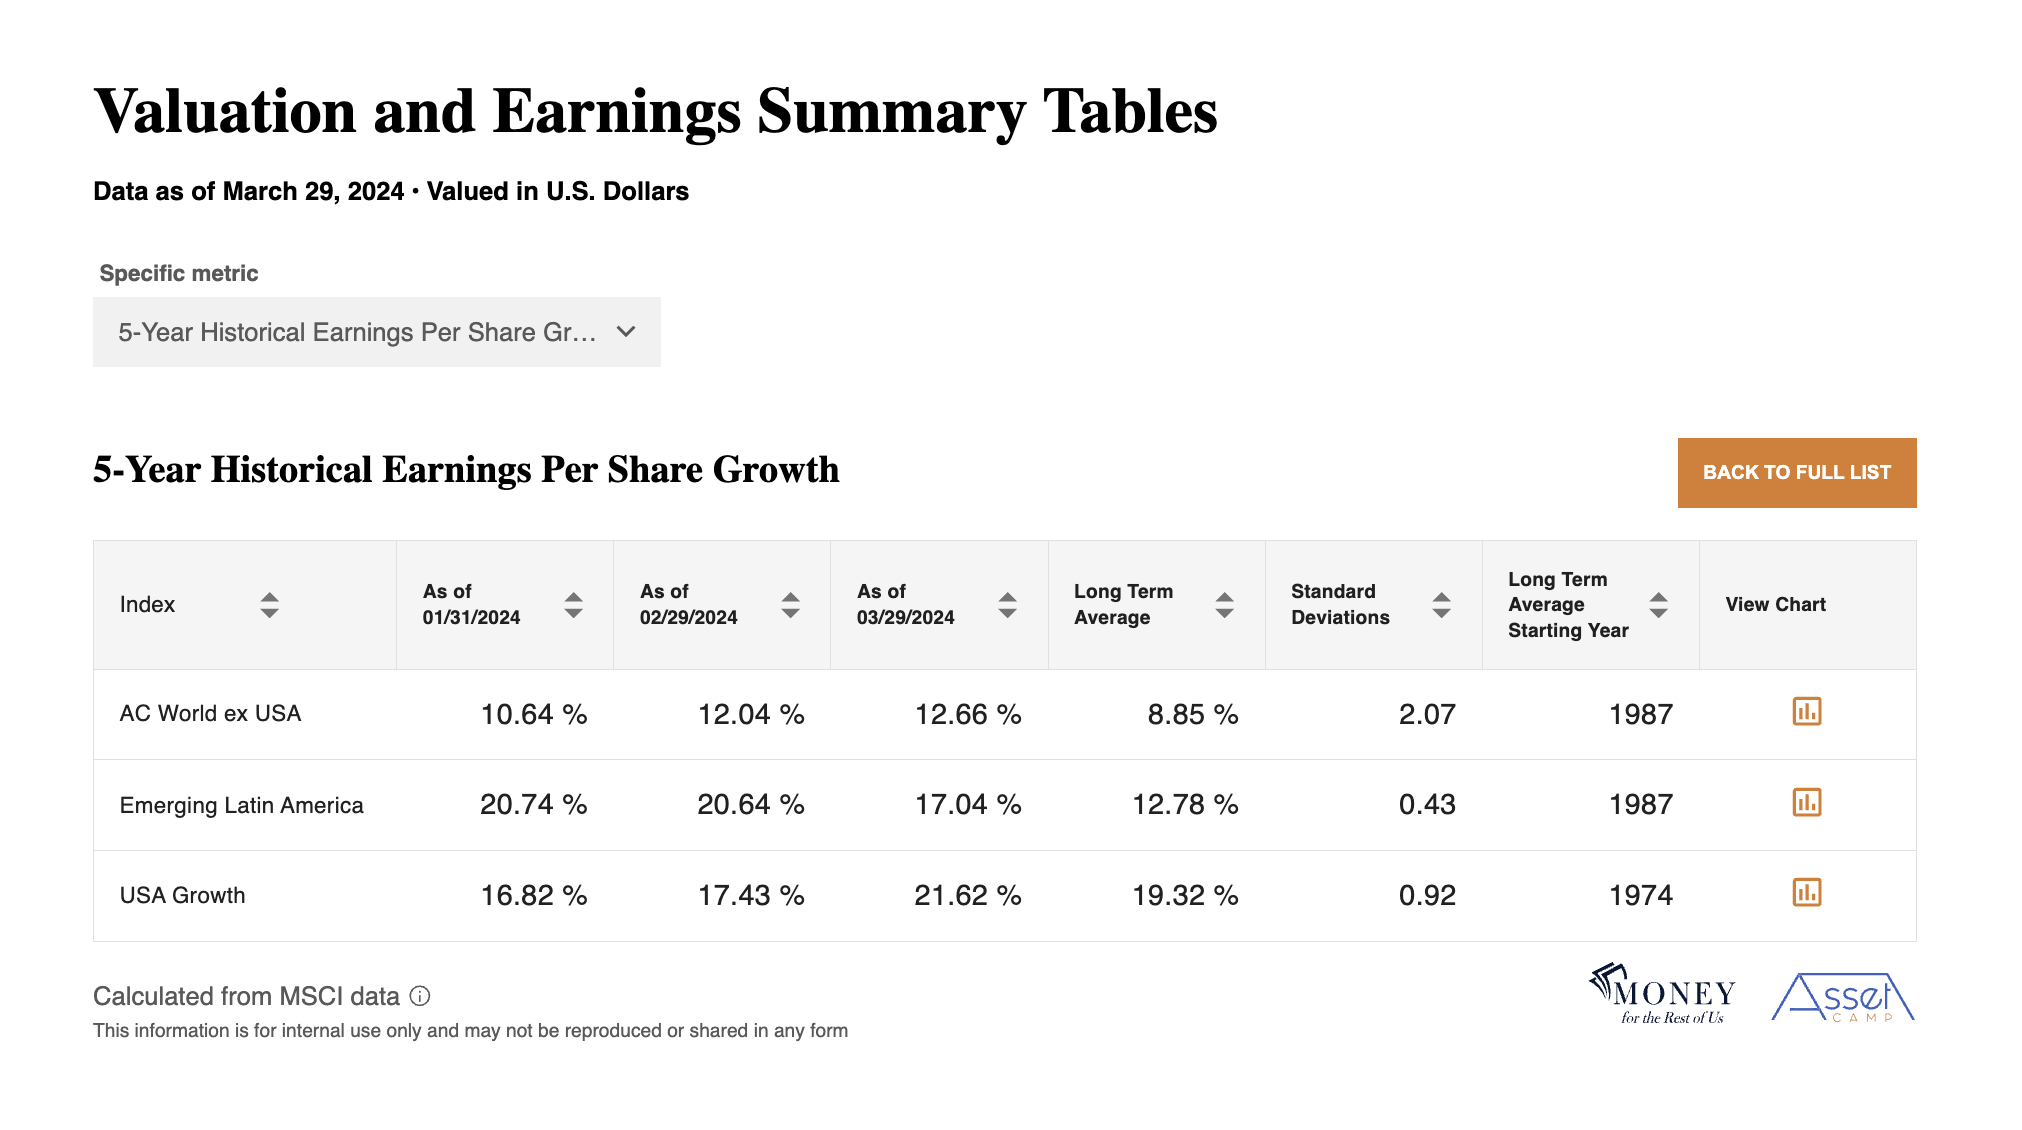
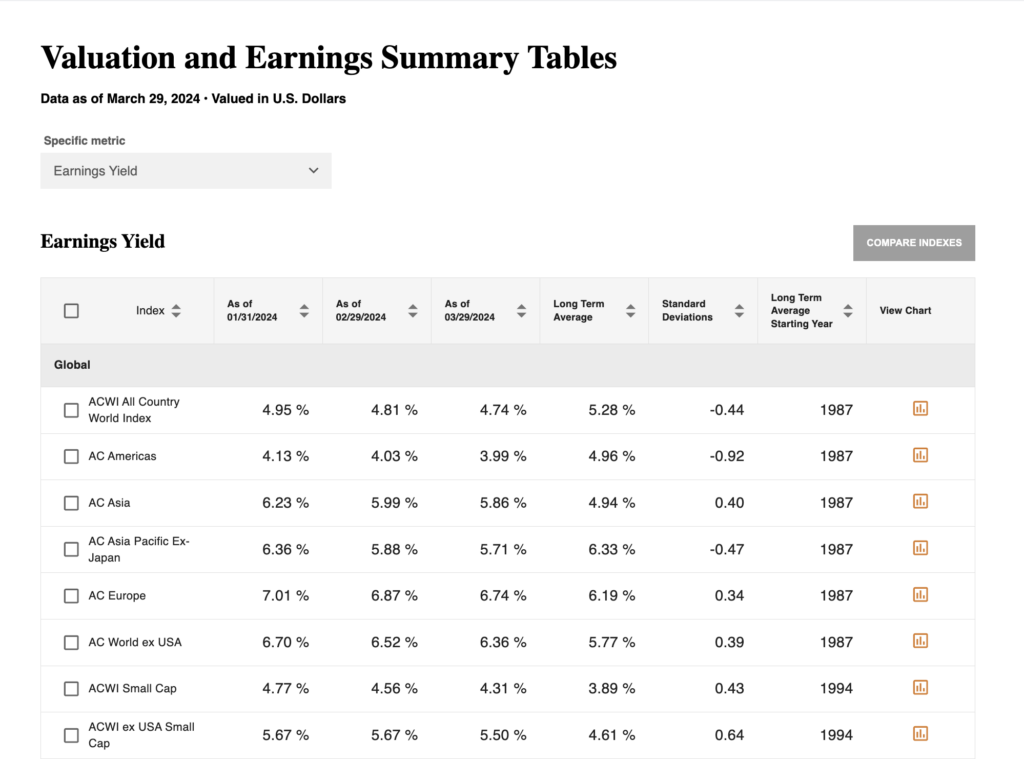
Asset Camp’s Stock Market Valuations and Earnings Summary Tables lets you quickly compare the valuation and earnings metrics across all 46 of our stock indexes. Easily see data for the last three months, the long-term average, and how much the current metric differs from the long-term average.

Full Fundamentals
Gain quick and comprehensive understanding of the current stock market fundamentals, including dividends, earnings, and valuations.
Measure Opportunities and Risk
See more completely where there are risks and opportunities, including which areas of the stock market are the cheapest or most expensive relative to each other and to the specific stock index’s long-term average.
Direct Chart Integration
Each stock index includes a quick view of the corresponding Valuations, Earnings, and Trends chart for the selected metric, giving you deeper understanding faster.

Rank and Sort
Rank and sort the indexes for any metric from lowest to highest, including how much the latest metric differs from the long-term average.

Focus Your Comparisons
Choose and compare only the stock indexes you are most interested in seeing, simplifying your table view.
Ready to take your next step?
Act on the same data as the professionals.

