A stock index’s dividend yield will always be a positive number so it is a consistent driver of long-term common stock performance.
Likewise, earnings growth over most decades is also a positive number. As earnings grow, the dividends you receive for your index mutual fund or ETF grow.
Over multi-decade periods, dividends and earnings growth are the primary drivers of stock market performance. The compounding of those cash flows over time builds wealth.
Valuation changes and currency exchange impacts are temporary factors that often reverse.
Asset Camp’s 10-Year Performance Attribution Tool allows you to select different ending periods to view the historical return data. In doing so, you can see how dividend yields are consistent return drivers. Earnings, likewise, are usually positive, although they will vary more than the dividend yield.
Valuation changes and currency exchange impact are the variables that fluctuate the most, moving back and forth between positive and negative numbers.
In other words, the big performance swings we see from day-to-day or month-to-month for a stock index are usually because of valuation changes or currency impacts. This volatility is driven by investor emotion—their fear and greed.
By comparing historical returns over different time periods, we can see those emotional swings reflected in valuation adjustments and currency exchange impacts. Meanwhile, the earnings and dividends keep compounding, building our wealth.
Let’s compare two different time periods to understand these principles better. This first table compares the performance of Japan and the U.S.A for the ten-year period ending December 31, 2017. That time period includes the Great Financial Crisis of 2008 when earnings collapsed.
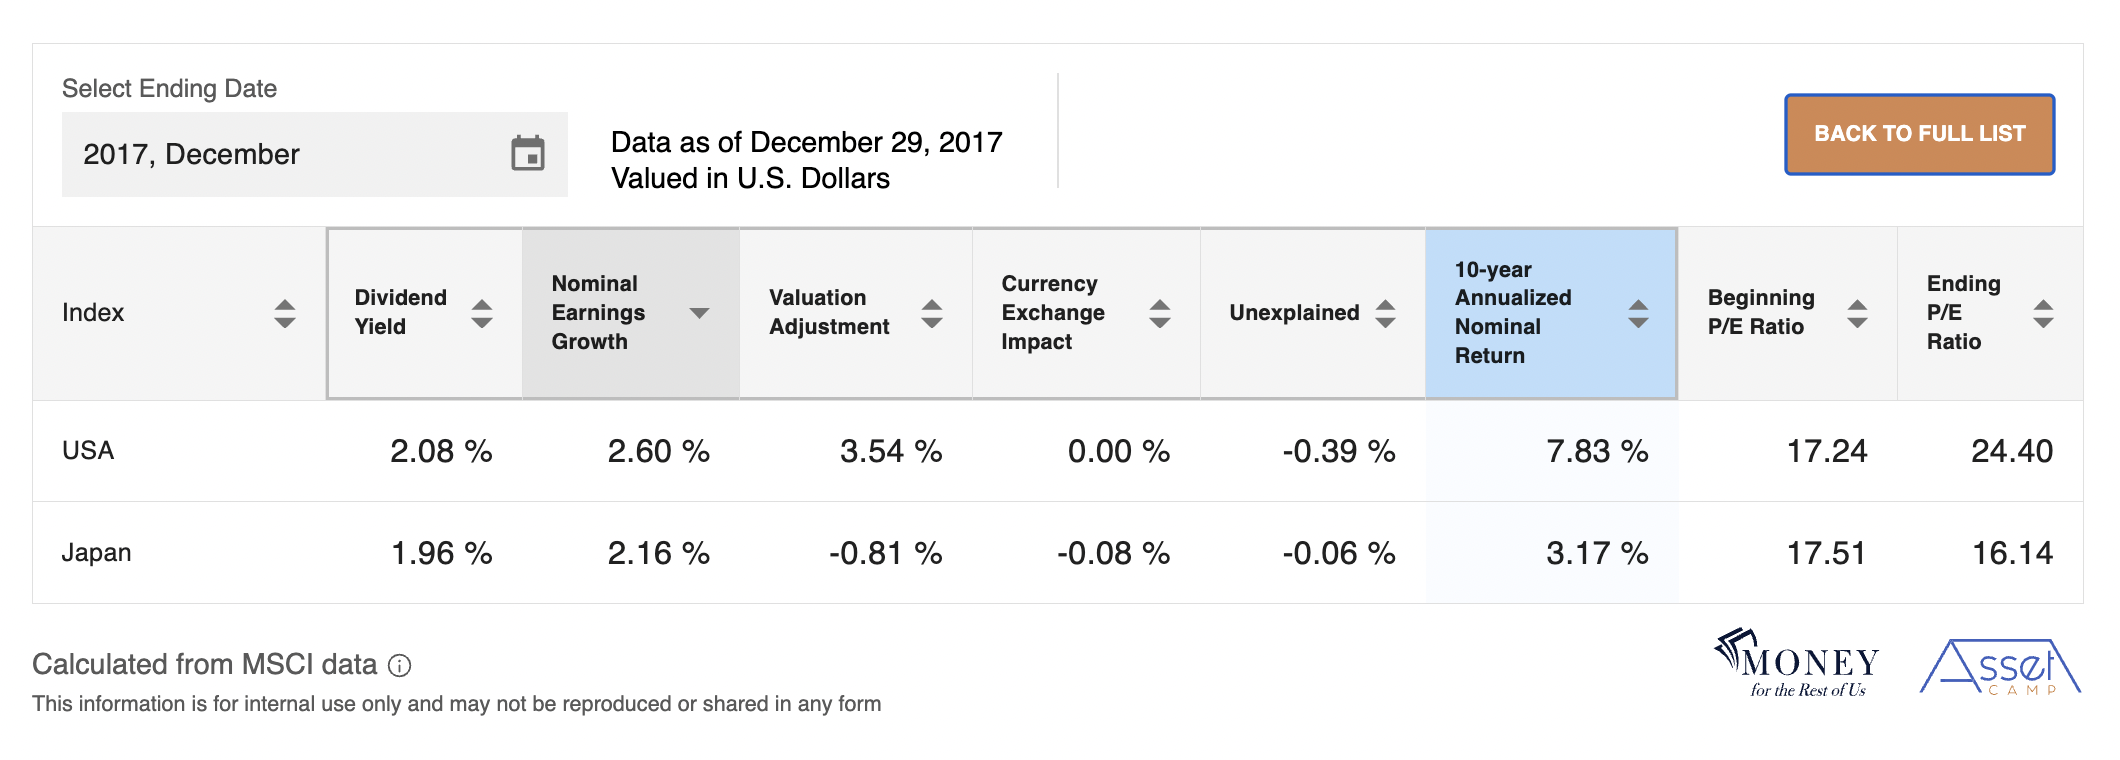
The U.S. and Japan had similar average dividend yields and earnings growth for the 10-year period ending December 29, 2017.
The U.S. outperformed Japan by over 4% per year because its stock market got more expensive while Japan’s stock market got cheaper.
You can see the performance impact of valuation changes for the U.S. and Japan in the column labeled Valuation Adjustment.
Now let’s compare Japan and the U.S. stock market performance for the ten years ending April 28, 2023.
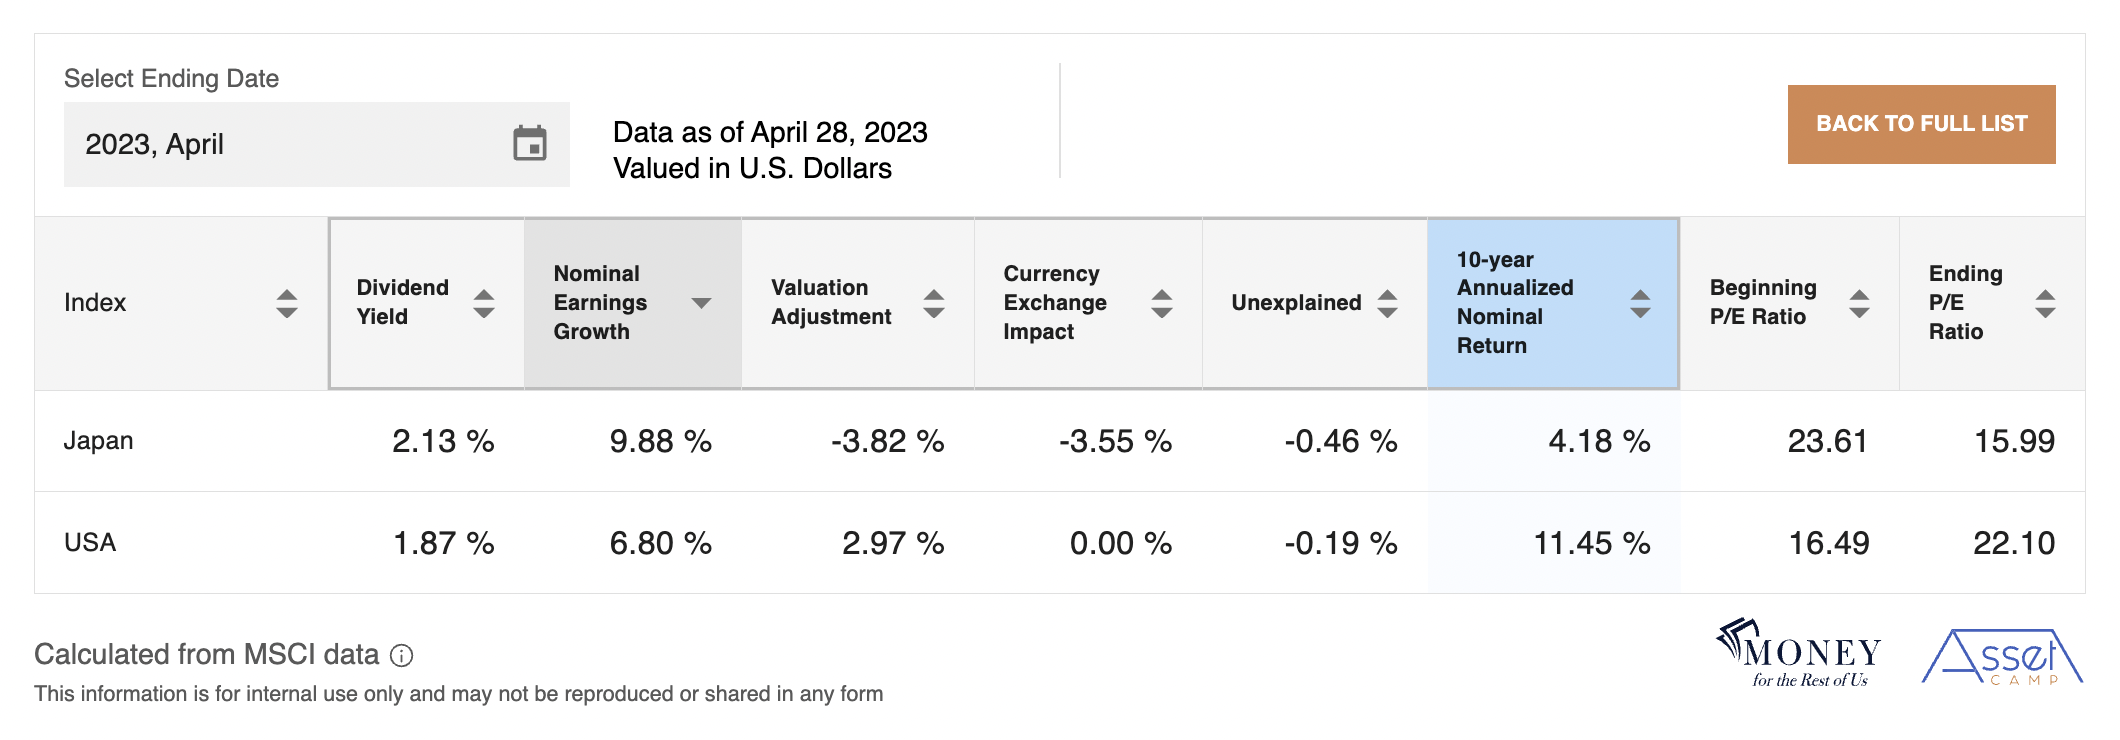
Both countries have a dividend yield of about 2%. Earnings growth has been higher over this ten-year period as Japan and the U.S. saw an earnings rebound after the Great Financial Crisis.
The U.S. outperformed Japan by an even larger amount in this decade because Japanese stocks got cheaper and U.S. stocks got more expensive. In addition, the Japanese yen weakened relative to the U.S. dollar.
In this example, we observe the more permanent nature of dividends and how they grow as earnings grow compared to the back and forth of valuation adjustments and currency impacts. Understanding the long-term impact of dividends and earnings growth can help us stay committed to stocks for the long term.
Now that we know what caused the U.S. stock market to outperform Japan for the ten-years ending April 28, 2023, in this Case Study, we use Asset Camp’s Stock Market Expected Returns Modeling Tool to determine whether it is reasonable for the U.S. outperformance to continue.


