Selecting the Indexes to Compare #
You can select up to five stock indexes to compare by checking the box next to the Index to Compare dropdown menu. The grey box in the dropdown menu will display how many indexes you have selected.
Selecting the Return Metric to Compare #
You can select and view four different return series in the dropdown menu in the “Metric to compare” box at the top left of the table.
The four performance categories are:
USD Net Return: These returns are in U.S. dollars and include the reinvestment of dividends, which is the share of profits distributed to common stockholders. The dividends reinvested are net of country-level withholding taxes on dividends.
Local Currency Net Return: These returns reflect the weighted local currencies of the index constituents. The returns include the reinvestment of dividends, the share of profits distributed to common stockholders. The dividends reinvested are net of country-level withholding taxes on dividends.
USD Price Return: These returns are in U.S. dollars and don’t include dividends. The returns reflect only the price change of the underlying stocks that comprise the index.
Local Currency Net Return: These returns reflect the weighted local currencies of the index constituents. The returns don’t include dividends. The returns reflect only the price change of the underlying stocks that comprise the index.
Selecting the Starting and Ending Dates #
You can select the performance measurement period by first selecting the year and then selecting the month for the beginning and ending dates. The beginning and ending dates are always the last trading day of the month.
Generating the Report #
After selecting the indexes to compare, the return category, and the beginning and ending dates, you generate the report by clicking on the orange Compare button.
If a valid date range is selected, the return for each index will appear next to the index name.
If performance data is not available for the beginning date selected, the report will indicate the date is out of range and will specify the first available date.
Annualized versus Cumulative Returns #
Returns in the performance summary table longer than one year are annualized. Annualized returns represent the compounded annual return of the index rather than total or cumulative return.
For example, a 10-year annualized return of 10% is equivalent to a 159% cumulative return.
An annualized return is the rate of return an investment would have grown each year if it had grown at a steady rate.
The cumulative return measures the total change in the investment over a set period without accounting for the compounding effect.
Key Outcomes #
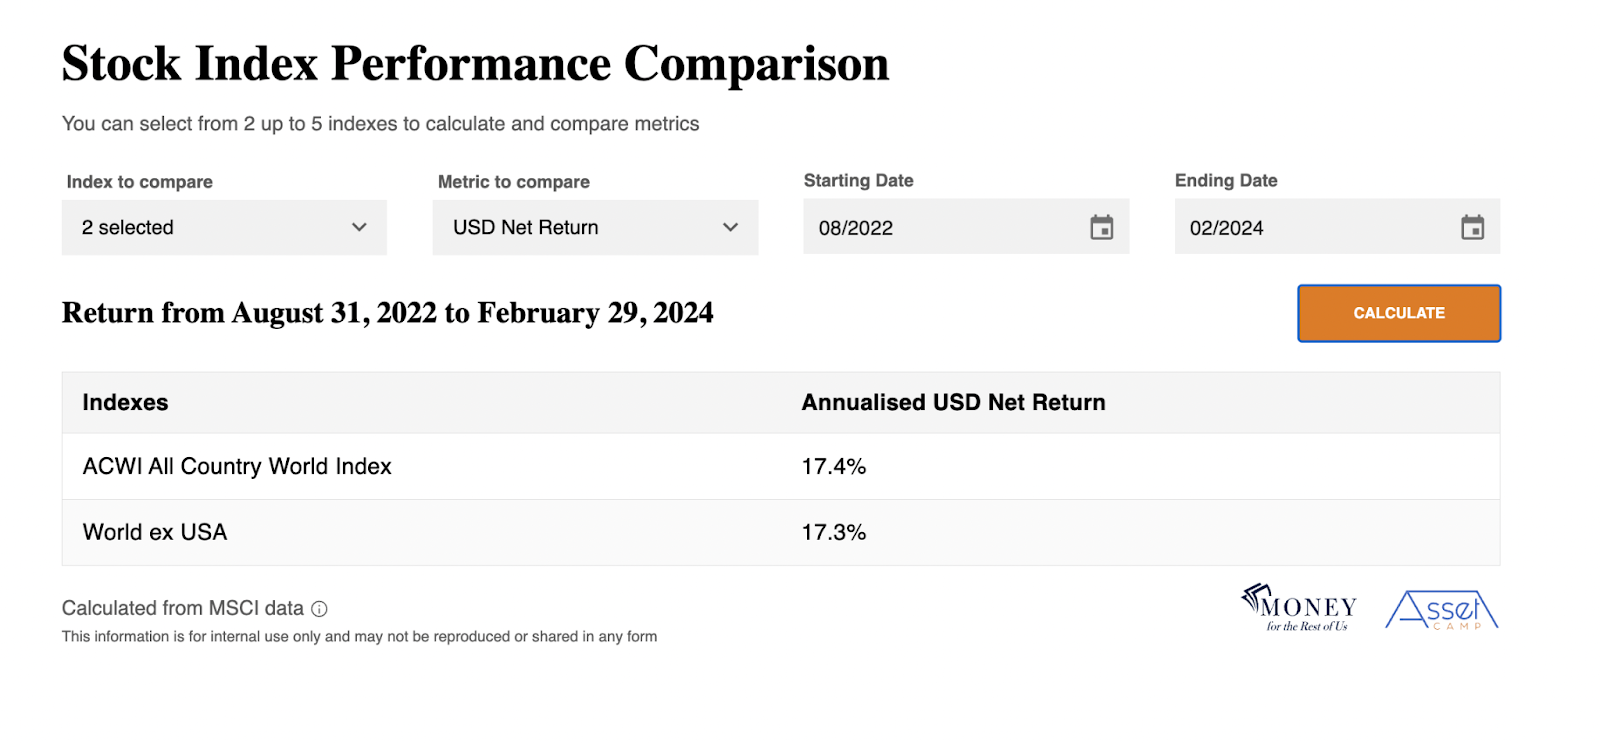
Asset Camp’s stock index performance comparison tool allows you to view stock market performance outside of the set time periods found in Asset Camp’s Stock Market Performance Summary Table.
For example, the Stock Market Performance Summary Table shows returns for one year and three years, but you might want to compare the performance of different indexes over the past 18 months. For that calculation you would use the Stock Index Performance Comparison.
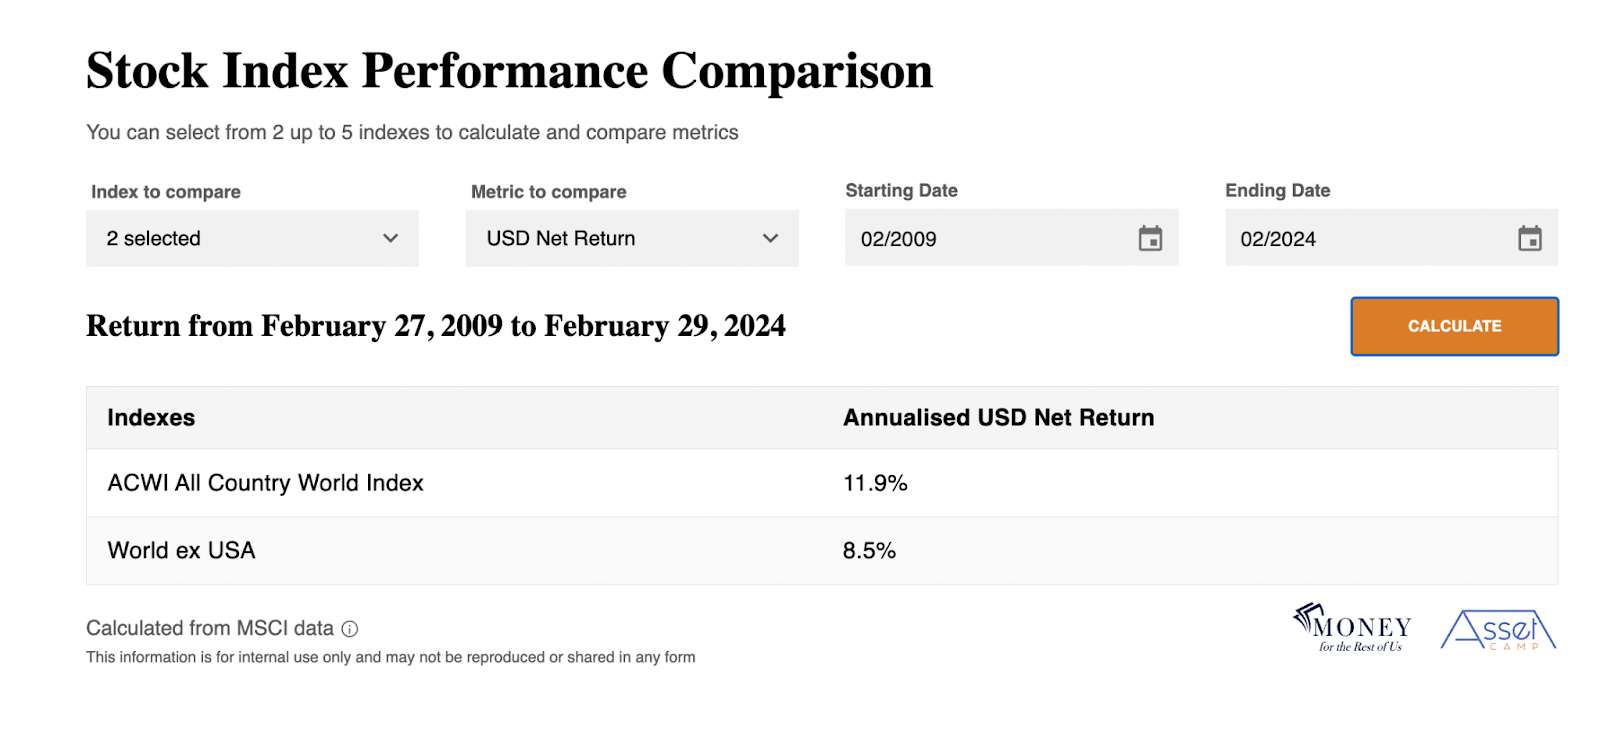
You might also want to compare the performance of stock indexes from a certain date when they hit an extreme valuation, such as the very low-price-earnings ration for global stocks in February 2009.
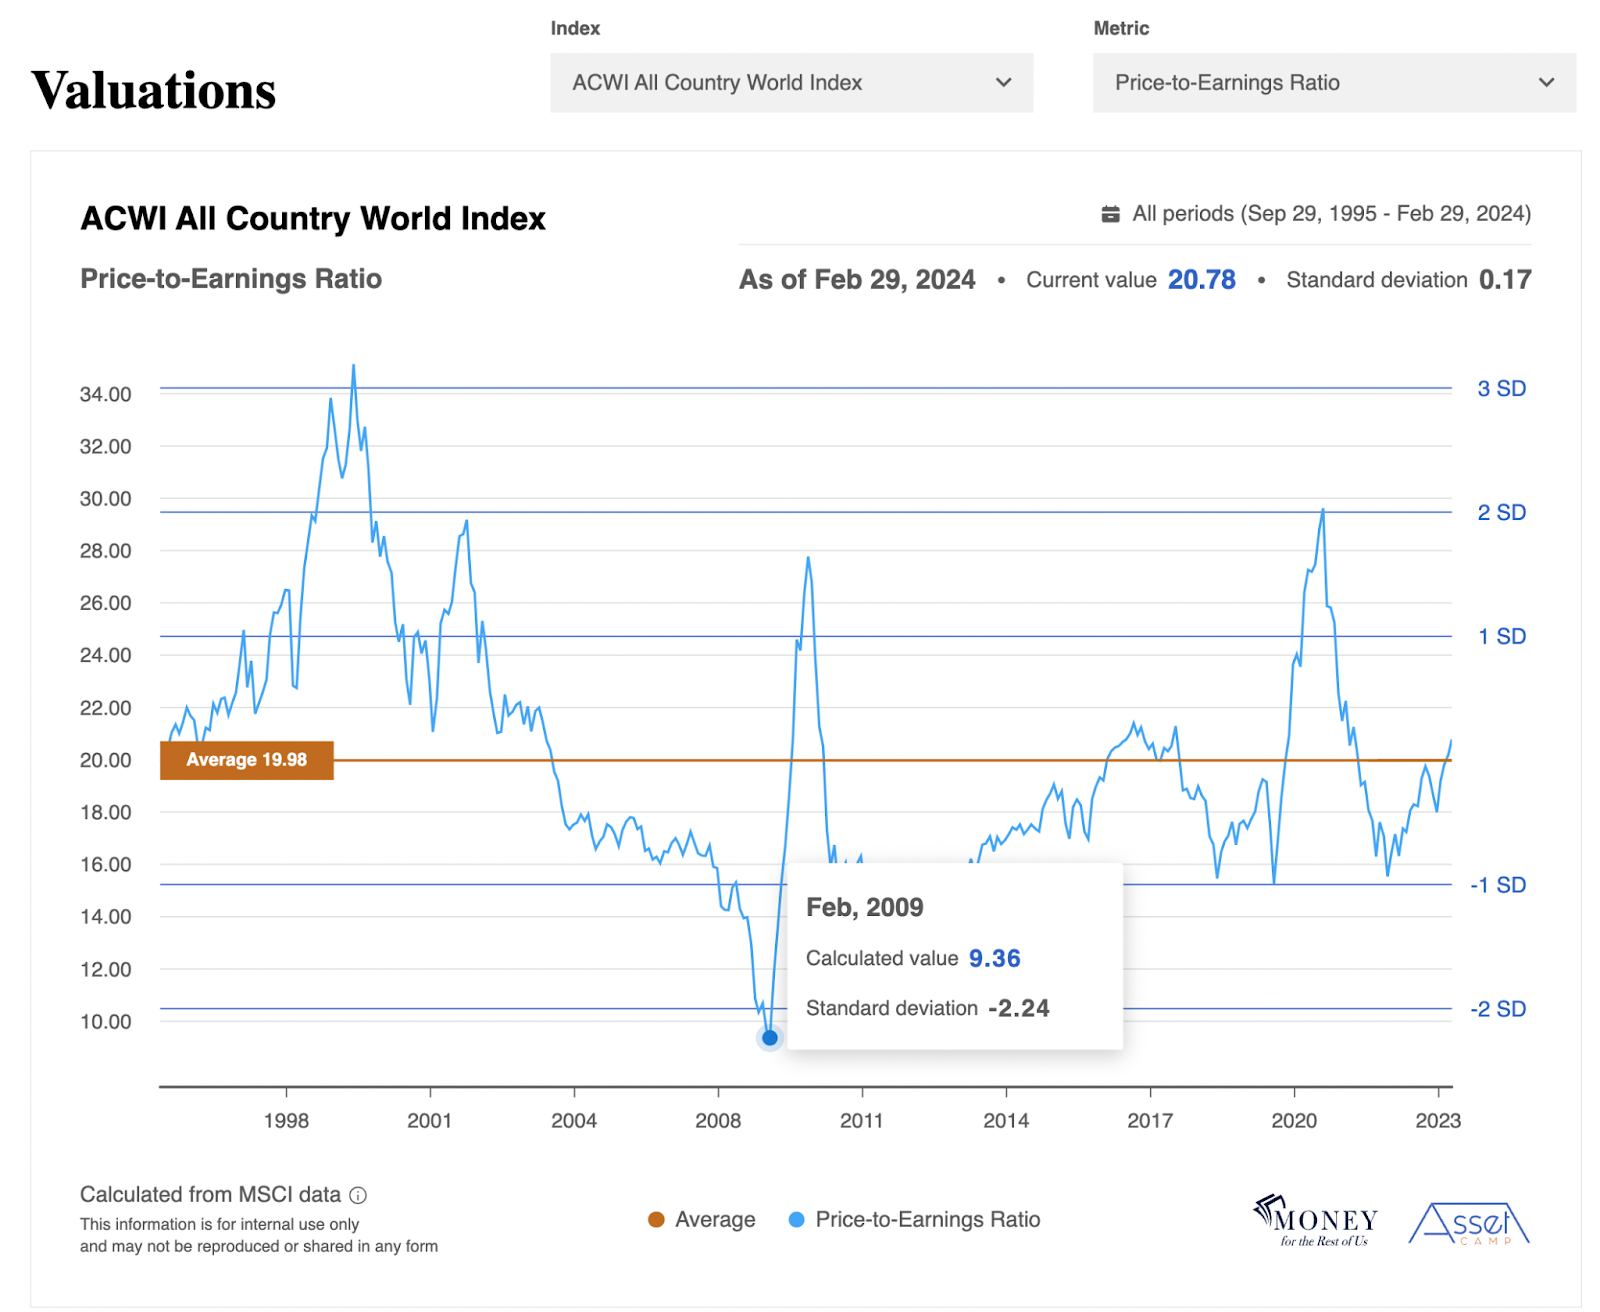
In this scenario, you would pick February 2009 as the beginning date.
The Stock Index Performance Comparison tool allows you to see the impact of dividends by comparing the price index returns to the net index returns. The difference between the price return and net return reflects the performance contribution of dividends
The tool also allows you to see the impact of currency fluctuations. The difference between the USD and local currency returns reflects whether the U.S. dollar strengthened or weakened relative to other currencies.
When the dollar strengthens over a certain measurement period, the local currency returns will be higher than the USD returns.
When the dollar weakens over a certain measurement period, the local currency returns will be lower than the USD returns.


