Asset Camp’s Stock Market Valuation, Earnings, and Trends Charts give you powerful insight into the current and historical state of 46 regional, style, and country-specific stock markets.
Previously, these types of reports have only been available to institutional investors.
Indexes #
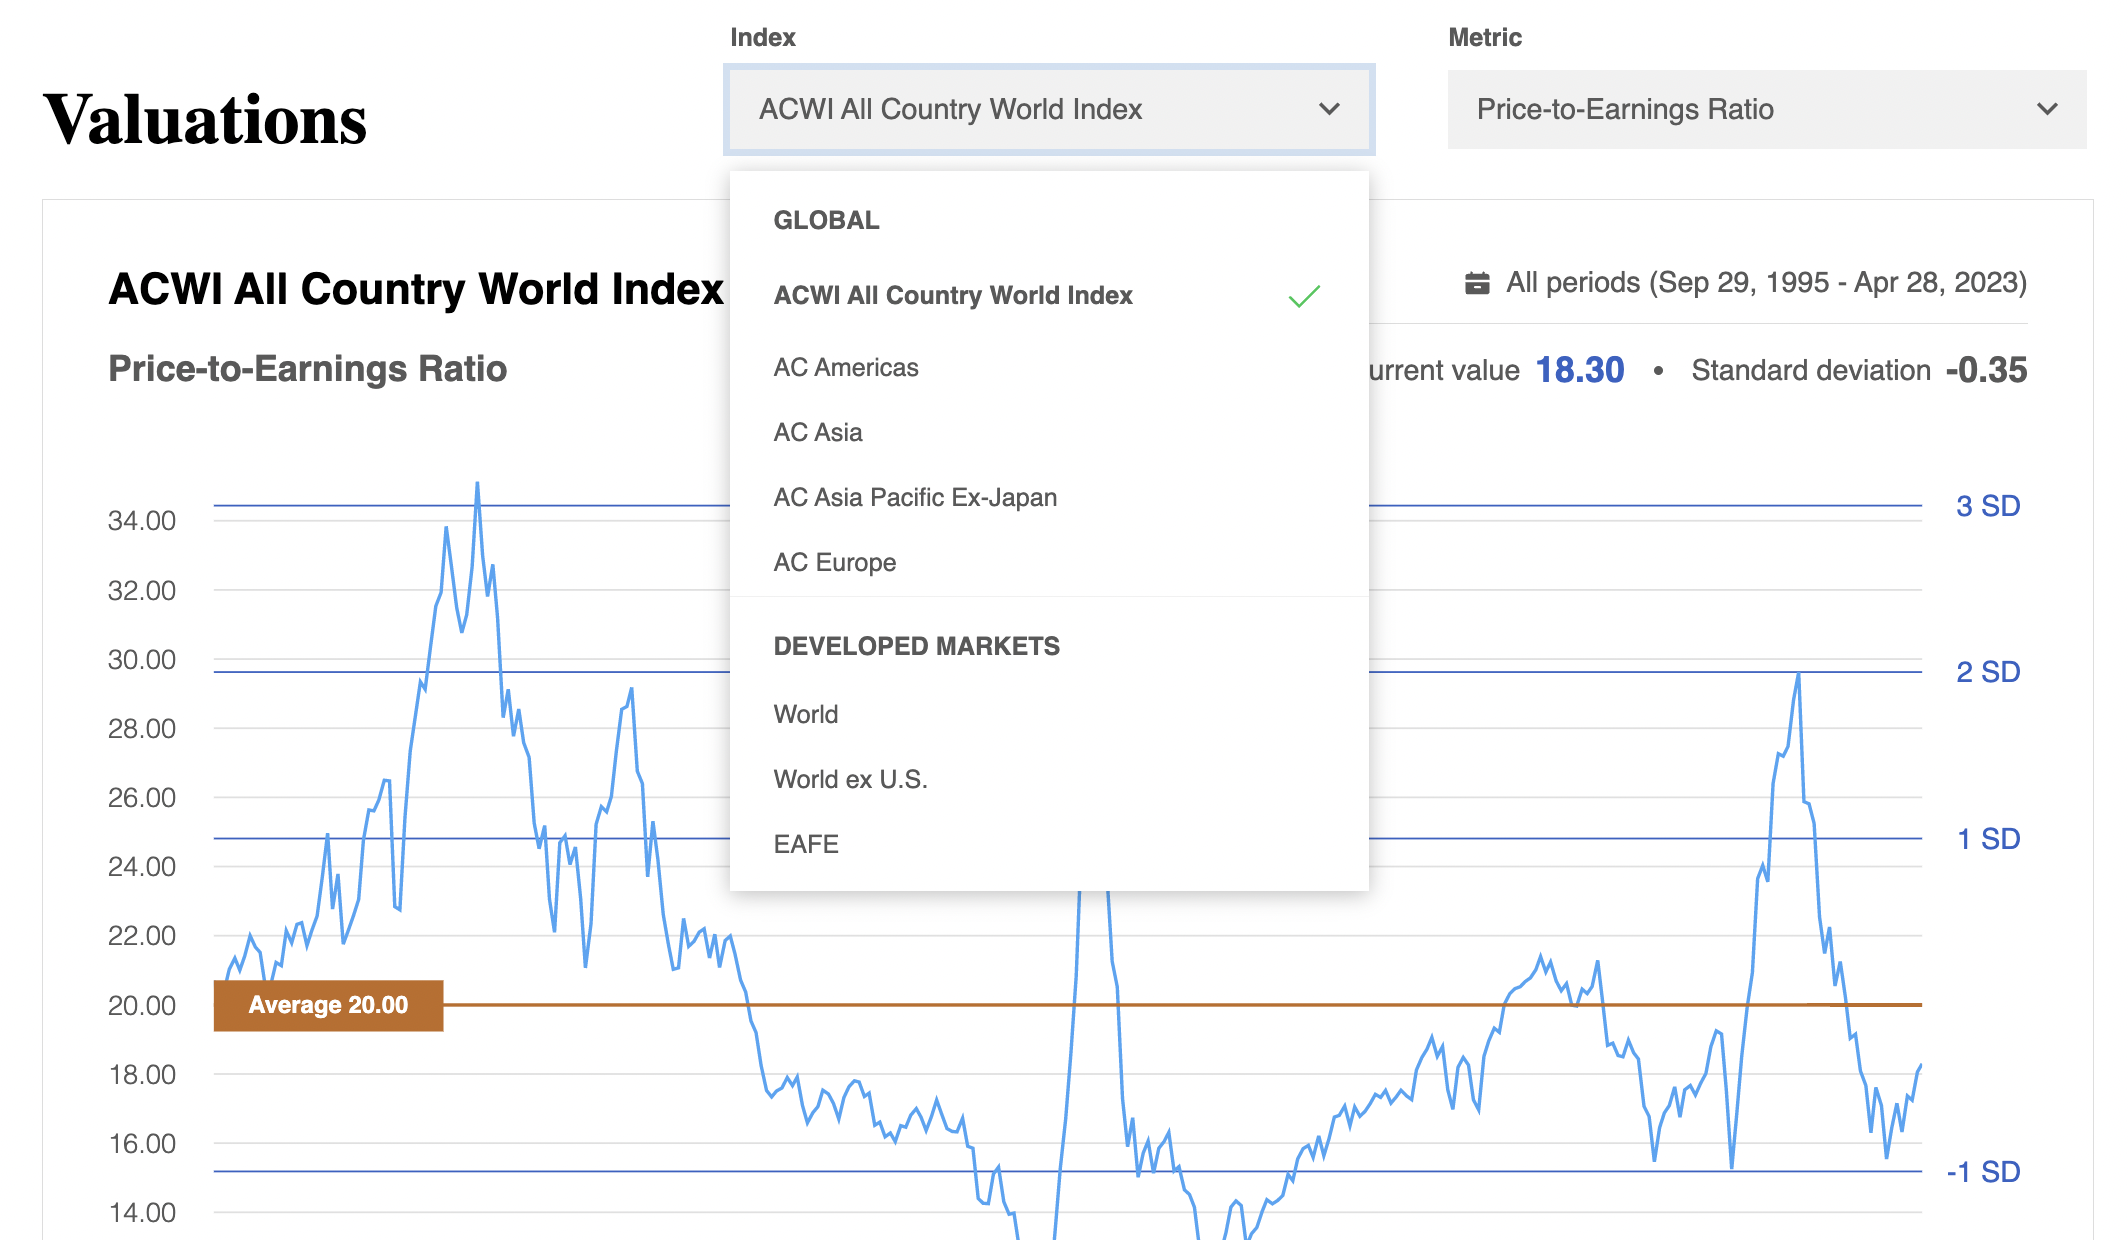
The reporting tool has two dropdown menus. The dropdown menu on the left allows you to select which of the 46 indexes you want to see.

The indexes are categorized by Global, Developed Markets, Emerging Markets, and Countries.
Global indexes contain stocks from both developed and emerging countries. These indexes have the symbols AC in front of them, which stands for All Country.
Criteria used to classify countries as Developed, Emerging, or Frontier include the consistency of a nation’s economic growth, accessibility of the stock market to foreign investors, the size of the market, and the ease with which investors can buy and sell individual stocks.
You can find a more detailed description of each index on this page.
Metrics #
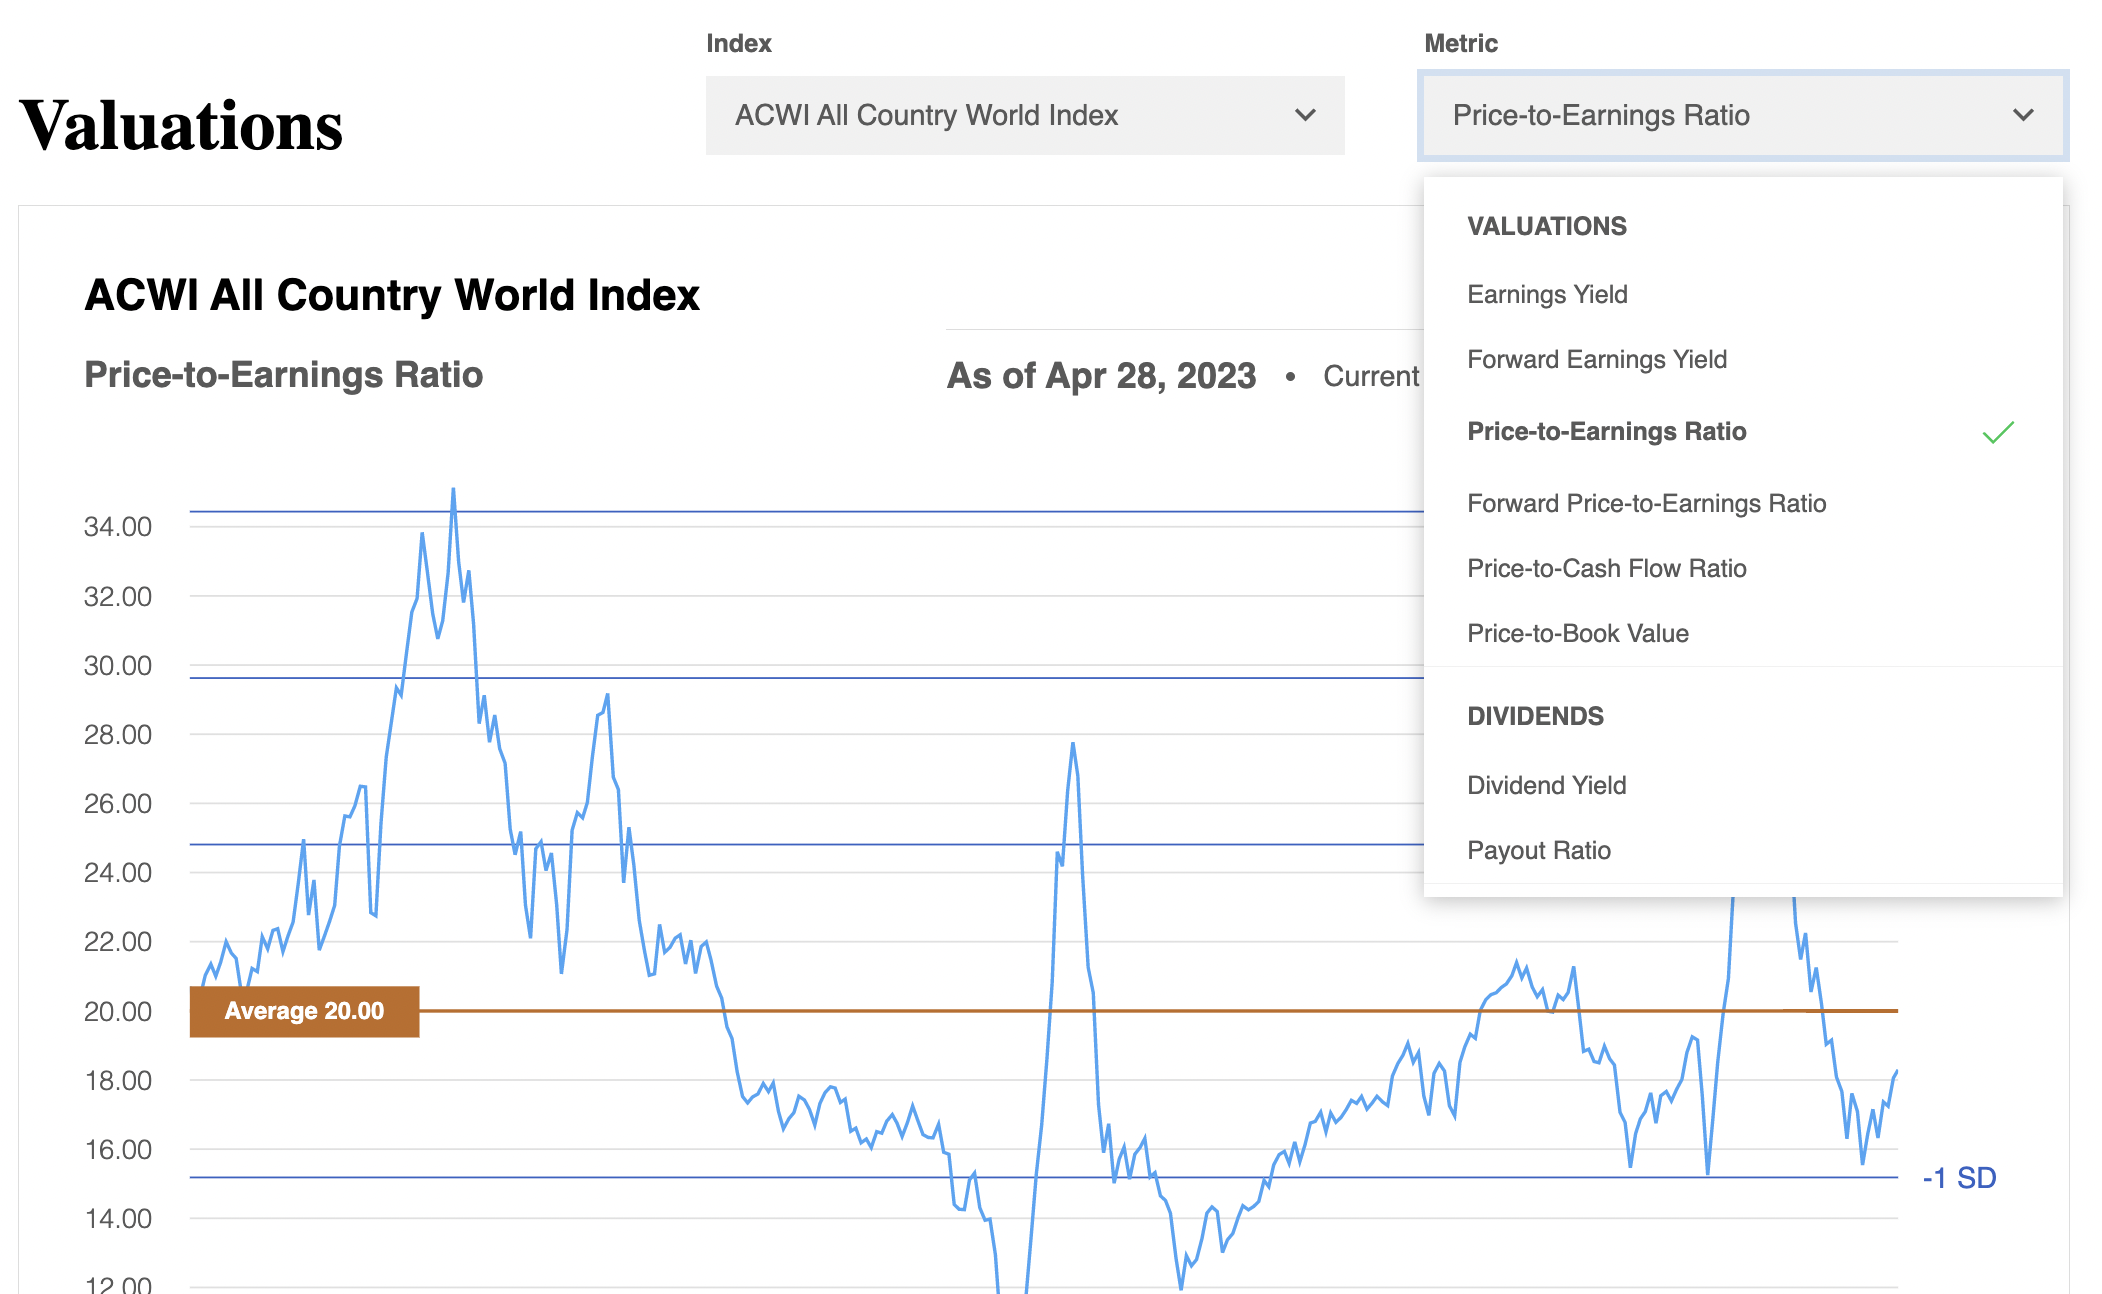
The dropdown menu on the right allows you to select which of the 21 metrics you want to see. The metrics are organized by Valuations, Dividends, Earnings, and Market Trends.

The Valuation metrics compare the price or level of the index to fundamental data such as earnings or cash flow.
The Dividend Yield metrics focus on data related to the payment of dividends.
The Earnings metrics contain sales and earnings growth charts.
The Market Trend metrics measure whether the index is in an uptrend or downtrend by comparing its current price to its average over the previous three or ten months.
You can find a more detailed description of each metric on this page.


