More Time Periods in Less Time: Get Snapshot Comparisons of Performance Across Custom Timelines
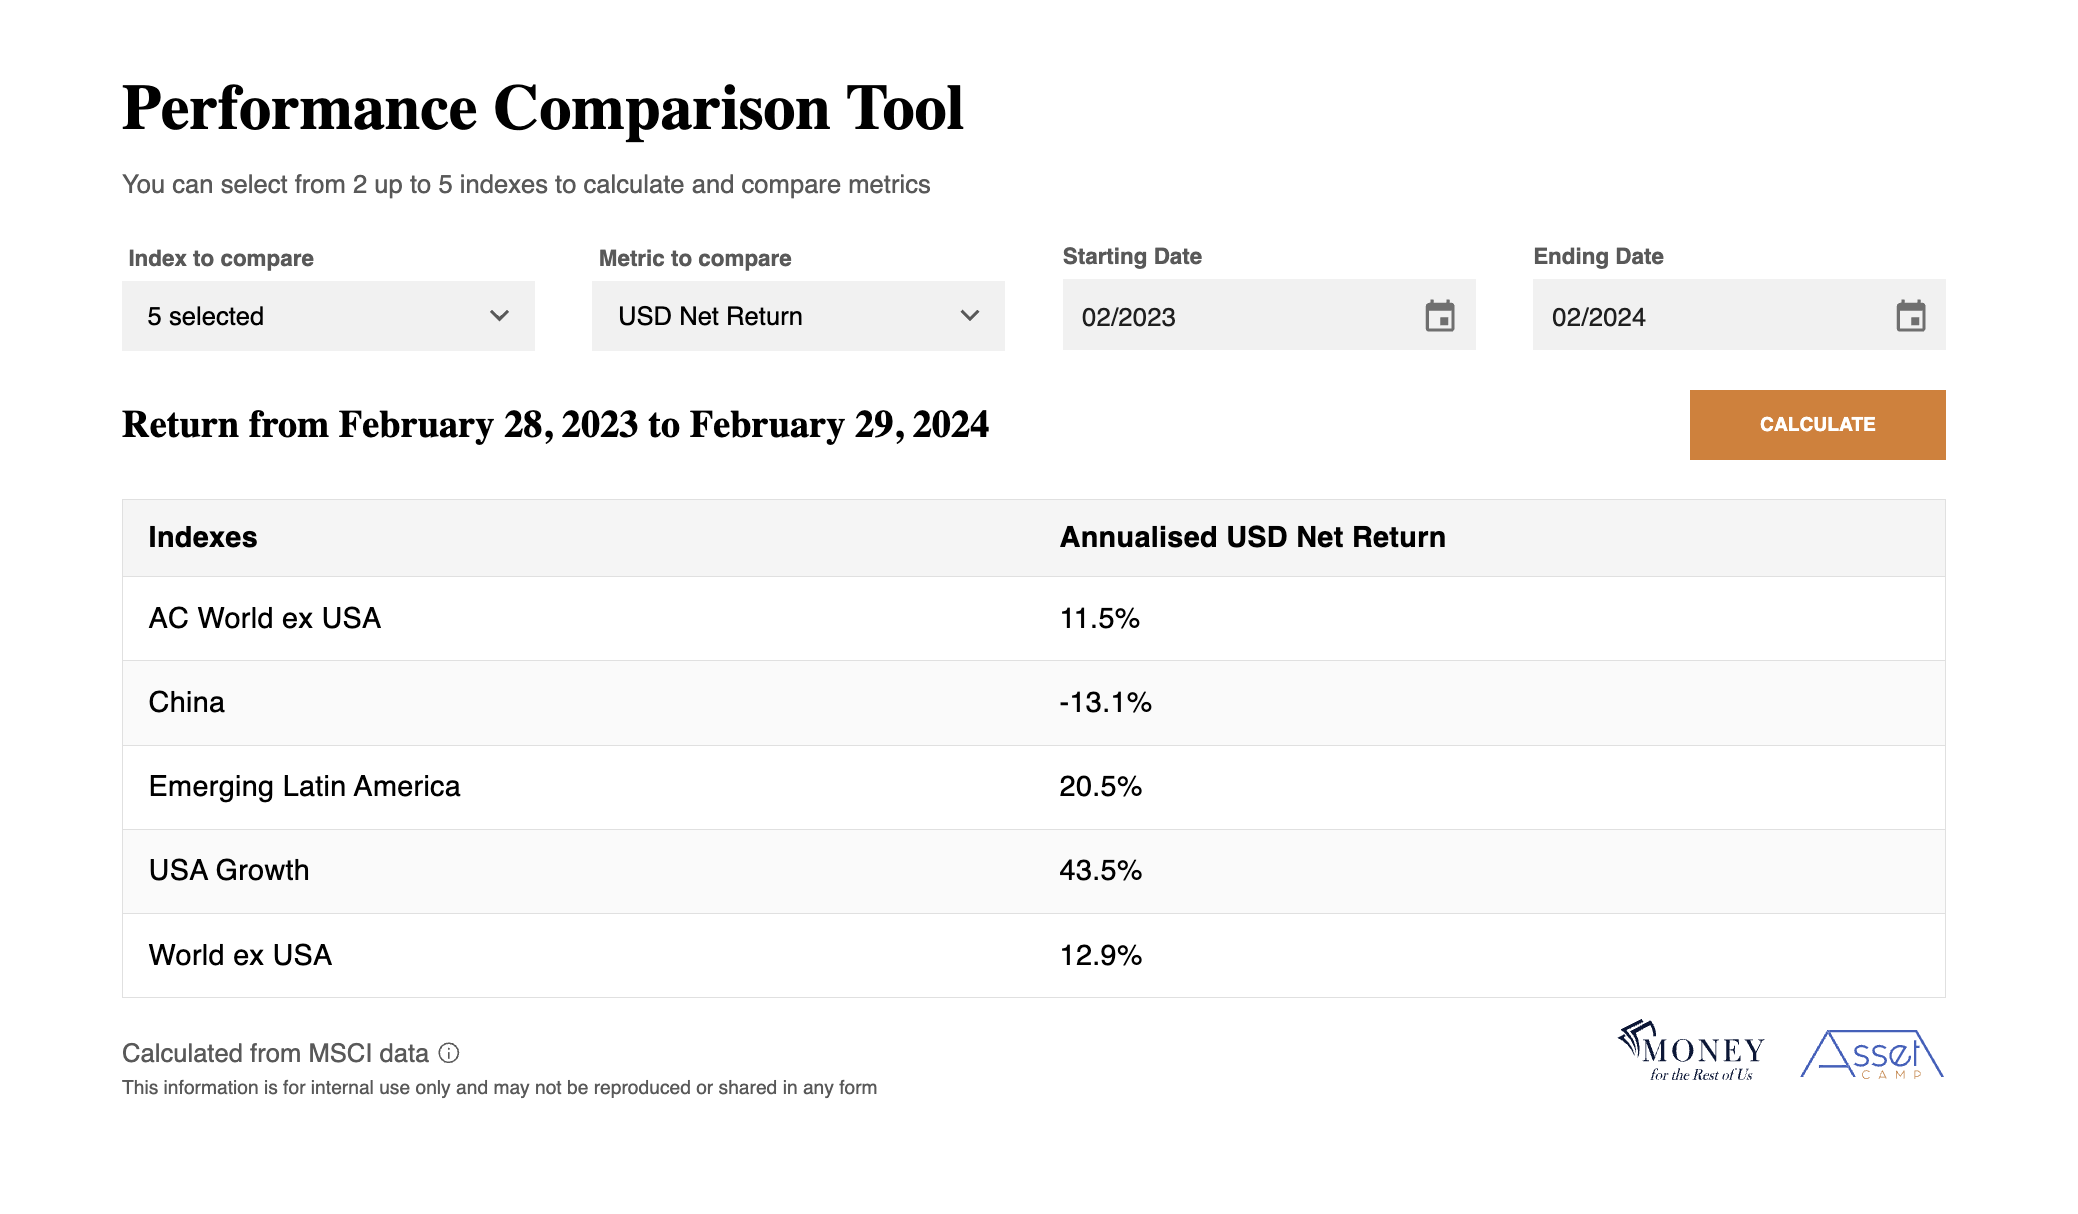
Asset Camp’s Stock Market Performance Comparison Tool lets you compare the performance of up to five selected stock indexes across any time period for which the data is available. You get to pick what matters most to you.

More Choice. Better Understanding.
Choosing custom time periods to compare stock market performance gives you the power to focus on the time frames that matter the most to you and your portfolio.
Long-Term Focus. Long-Term Confidence.
Gain confidence in your long-term investing by understanding long-term historical performance. Some of our index data goes back more than 50 years.

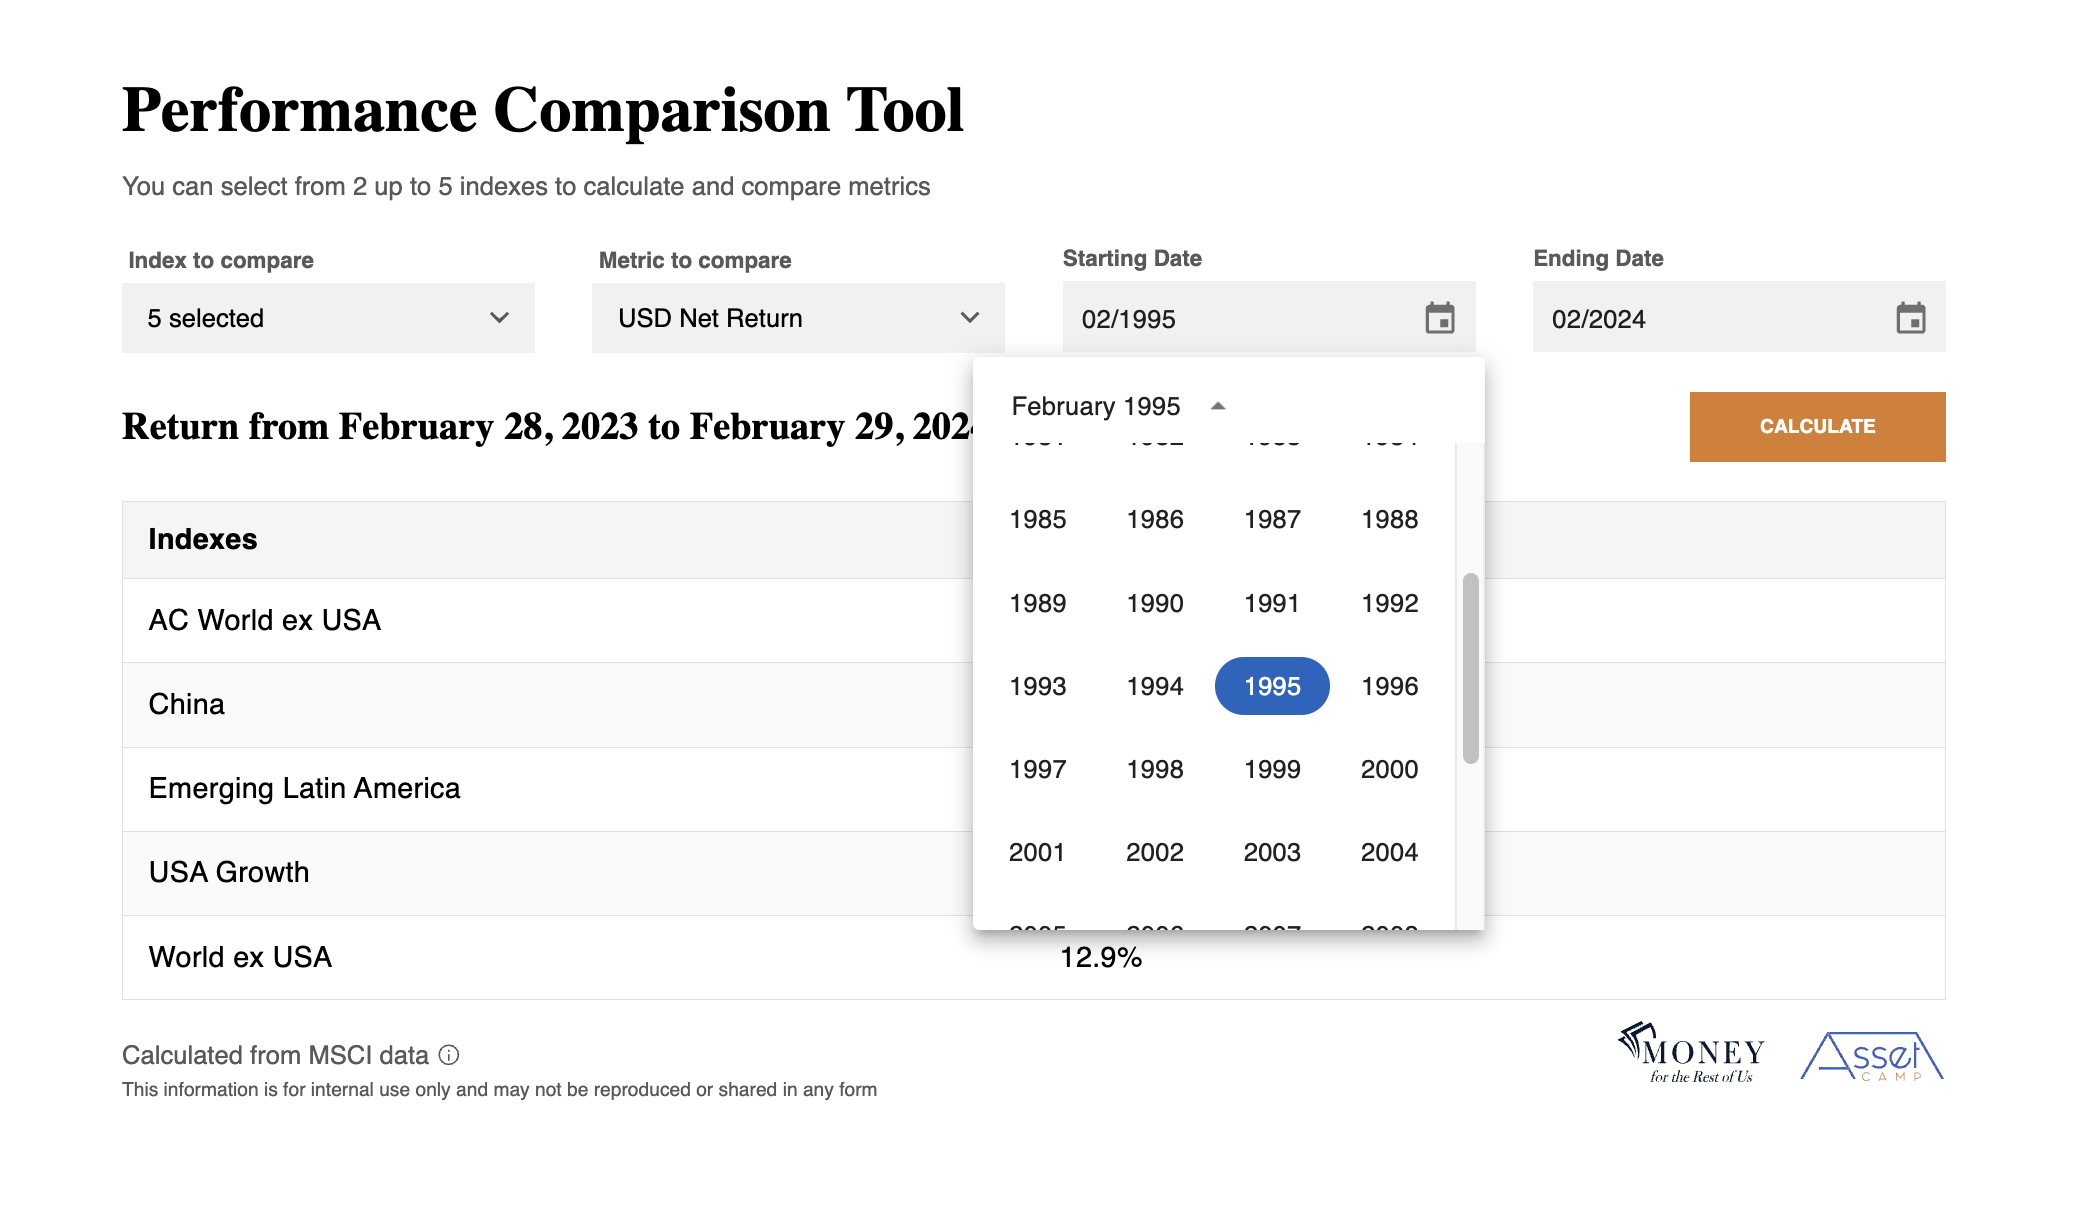
Choose Your Timeline
Measure return performance for one month, one decade, and beyond. You can choose any time period of performance, up to 50 years in some cases.

See the Direct Impact of Currencies and Dividends on Performance
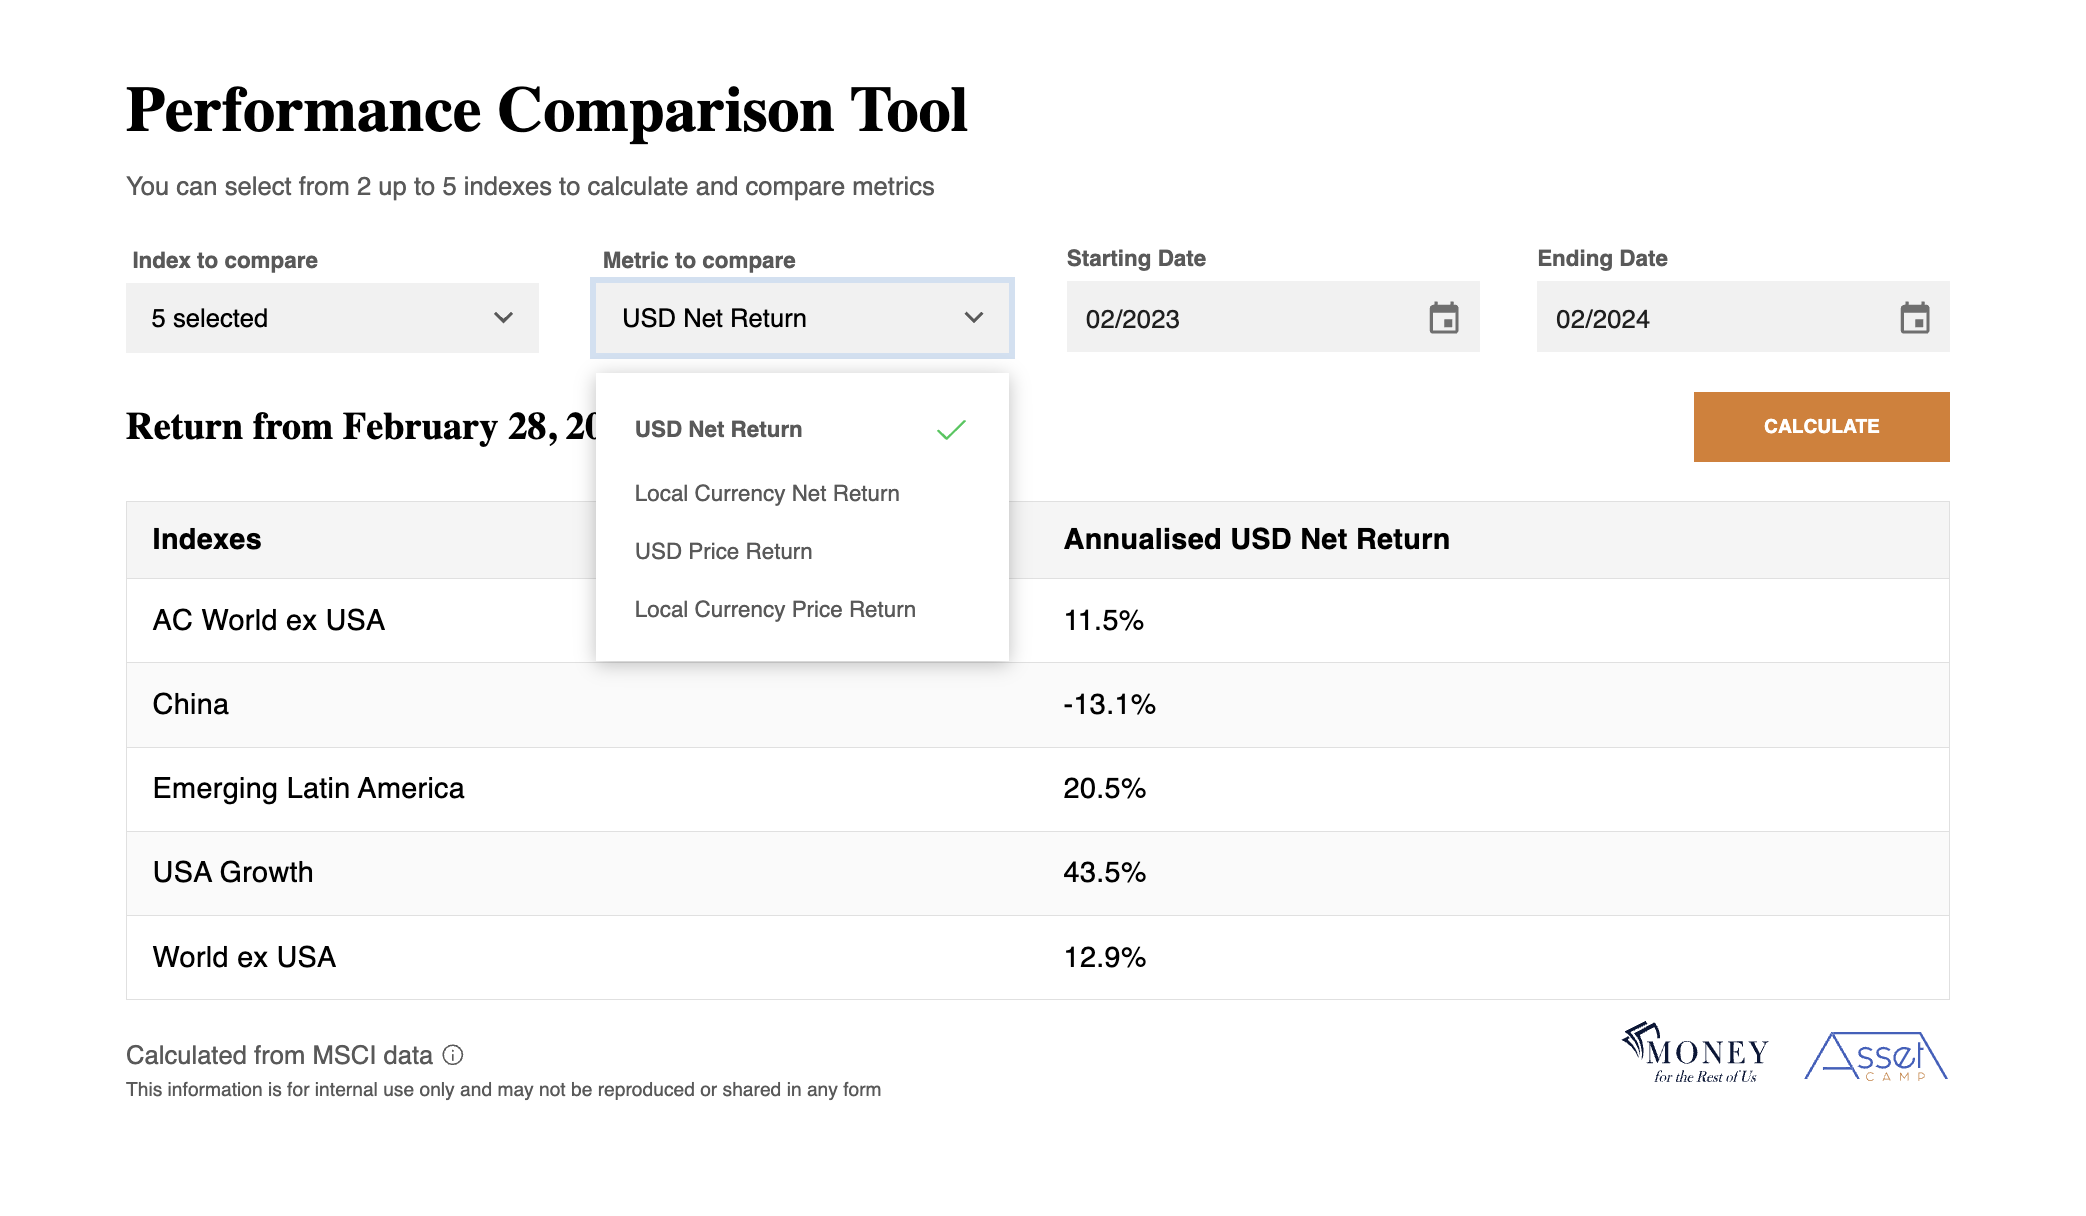
Clearly compare the outcomes of U.S. dollar returns compared to the indexes’ local currencies.
Also compare net returns that include dividends with price returns that exclude dividends.

Customizable Choices
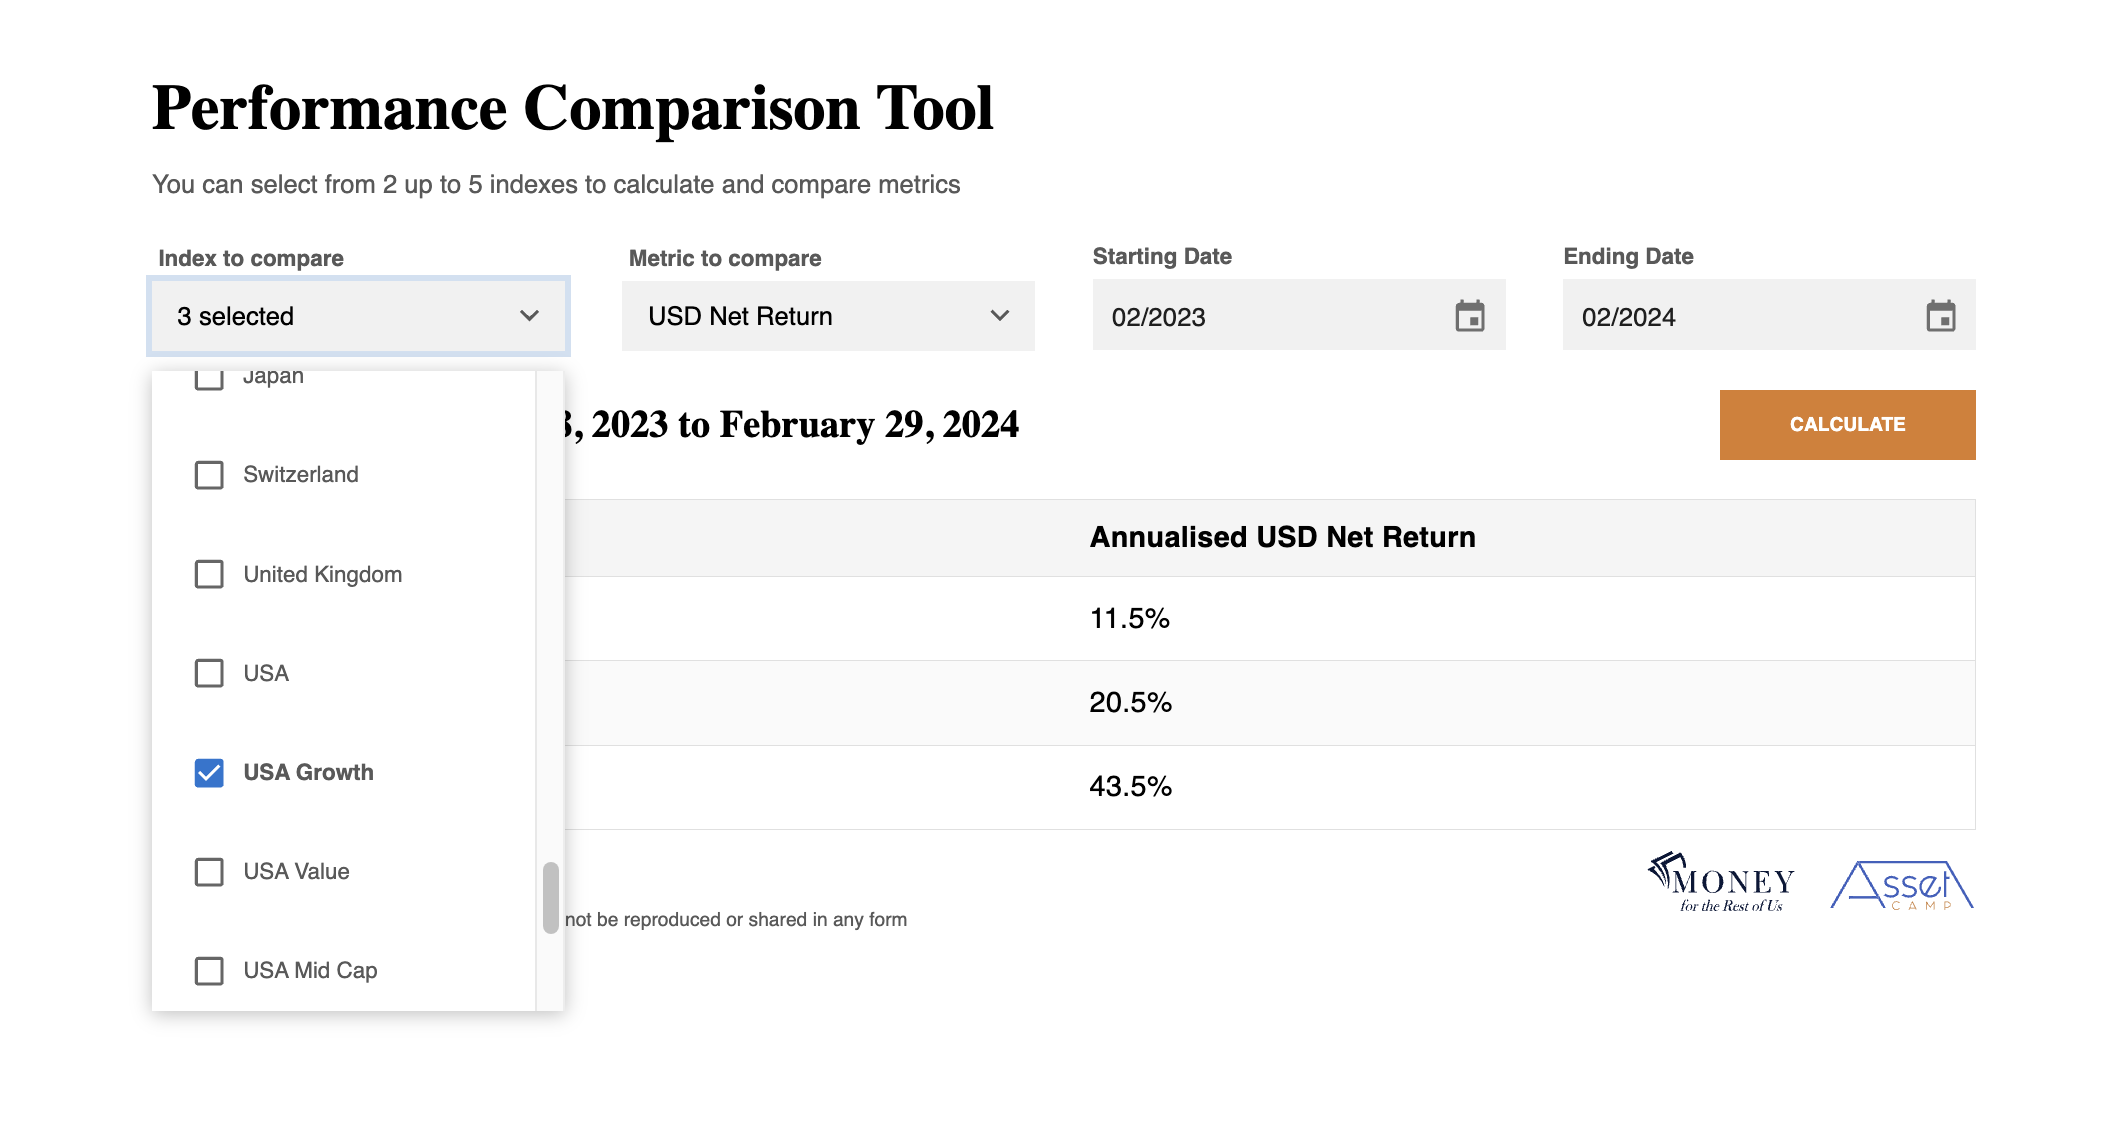
Choose to compare anywhere from 2 to 5 indexes over your chosen time period, giving you control to focus your research where it matters most.
Ready to take your next step?
Act on the same data as the professionals.
