Context is Key: Know Where Markets Stand and How They Are Trending
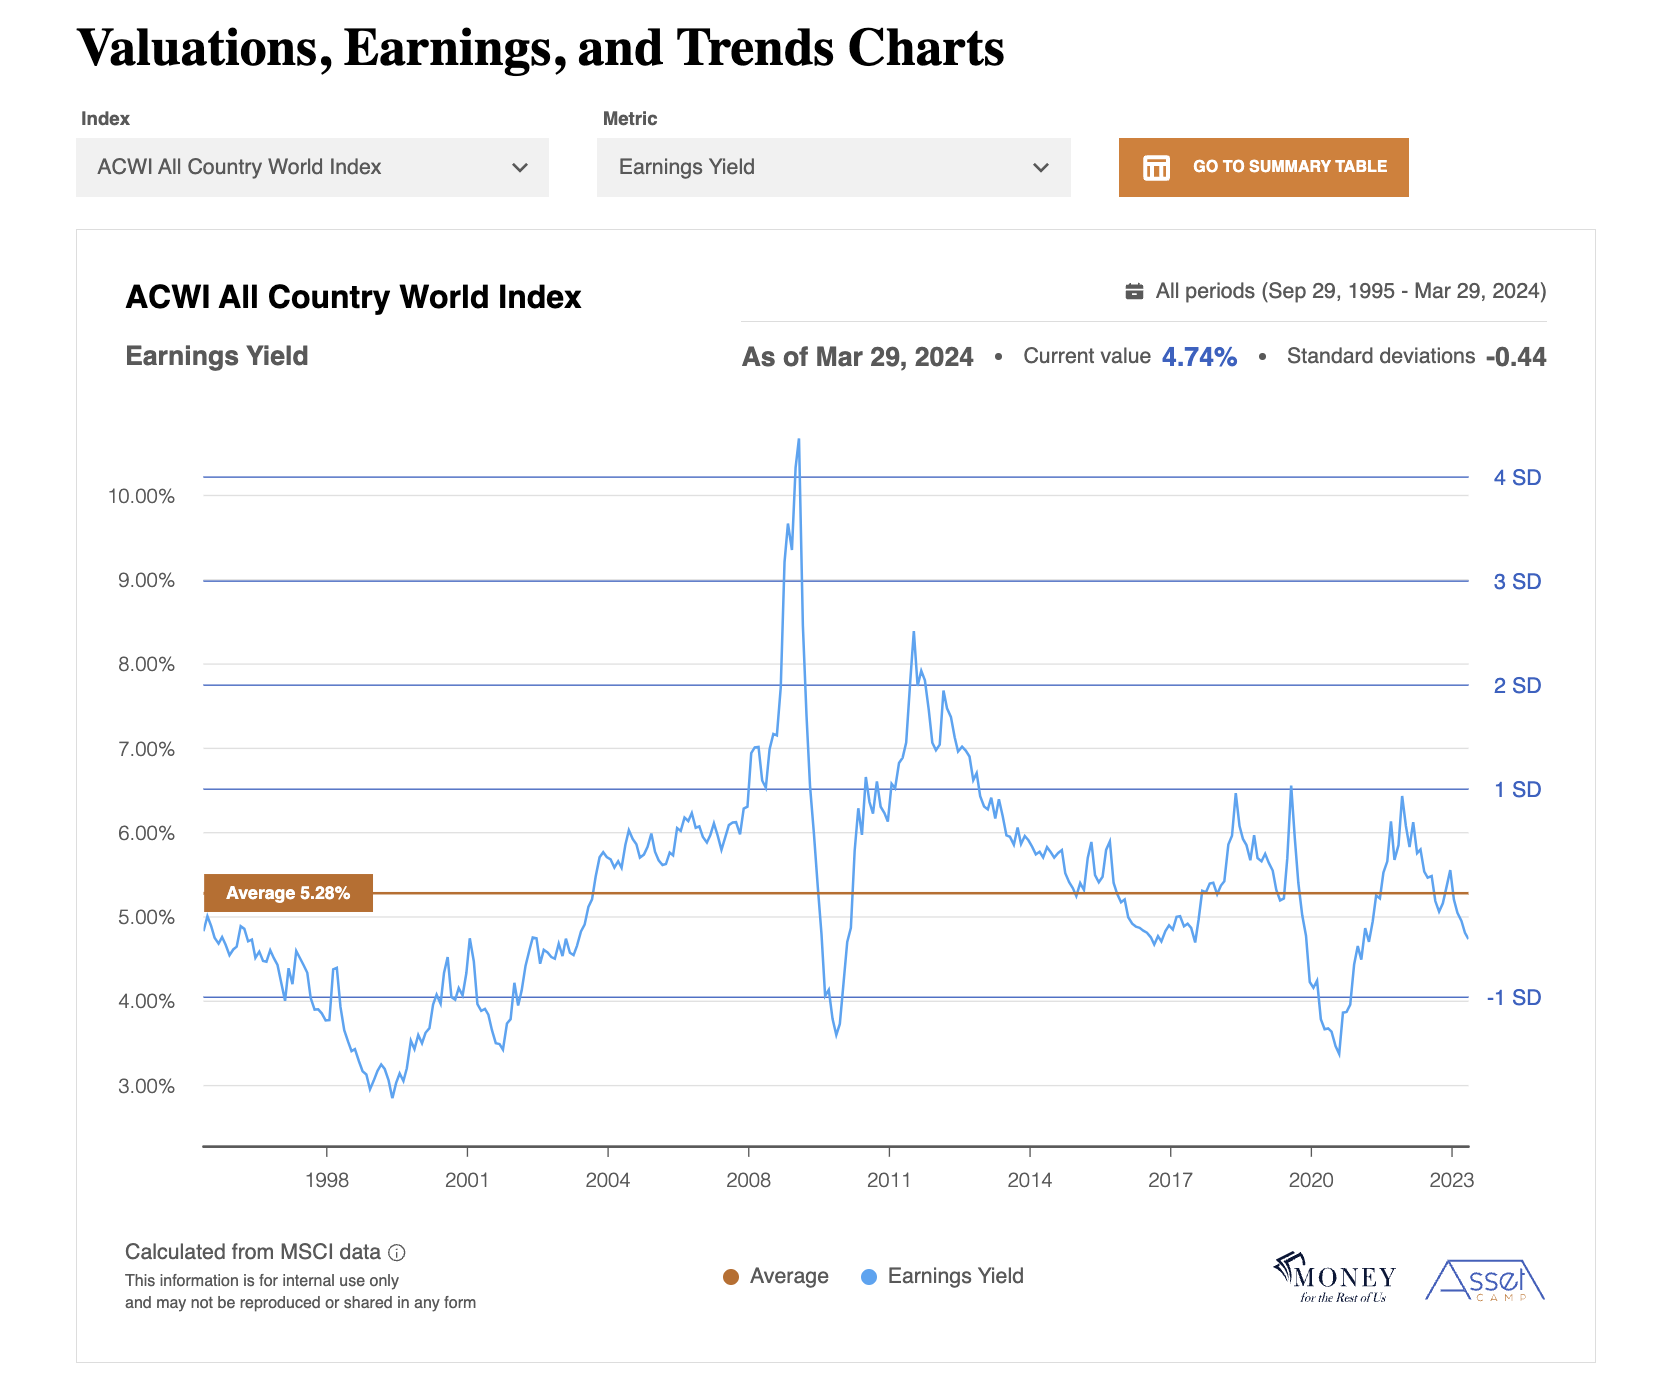
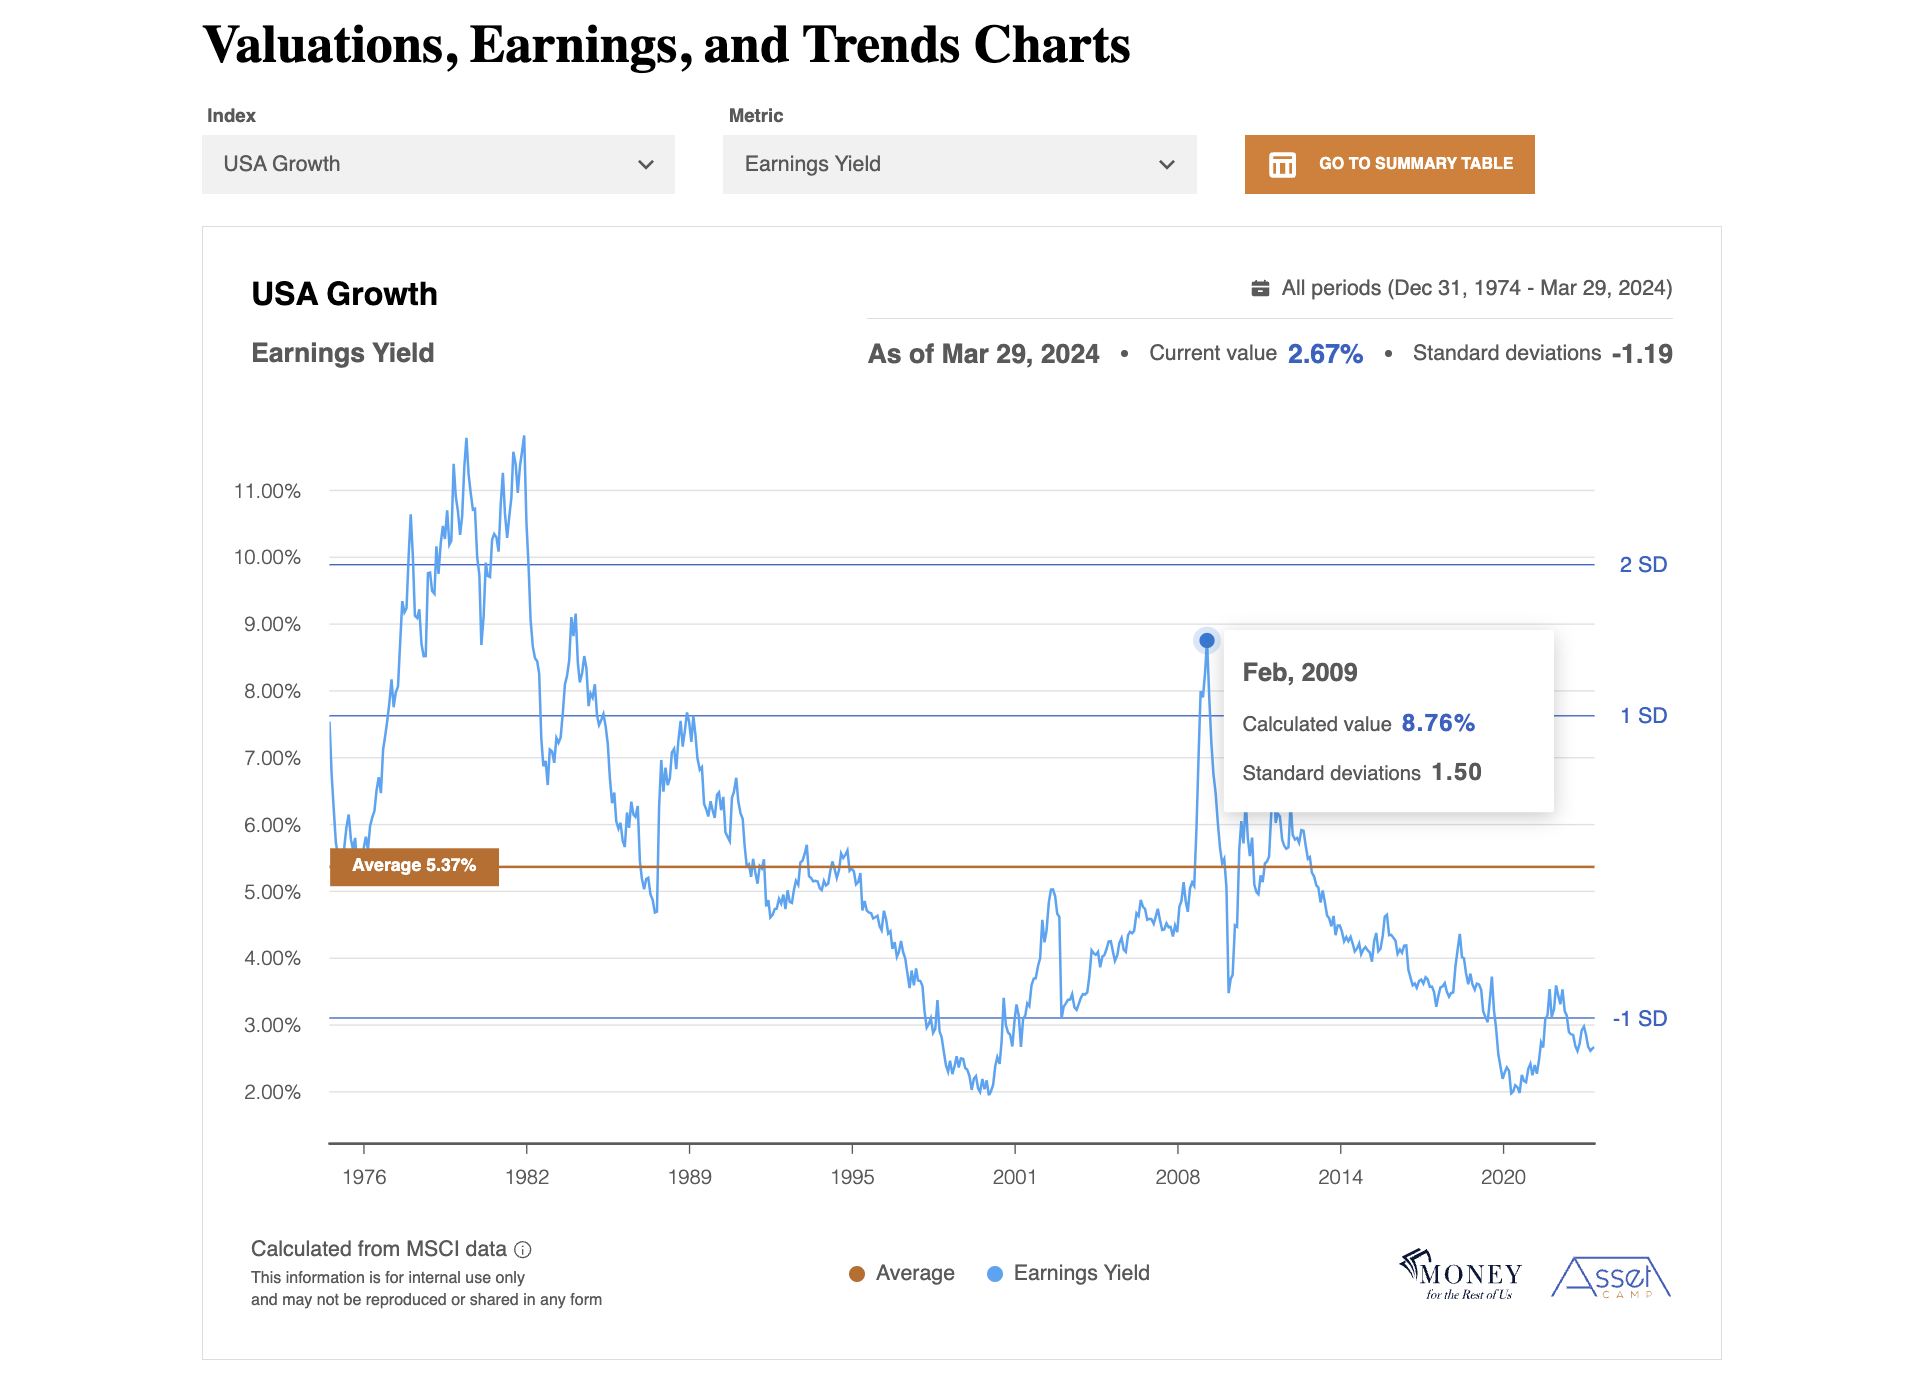
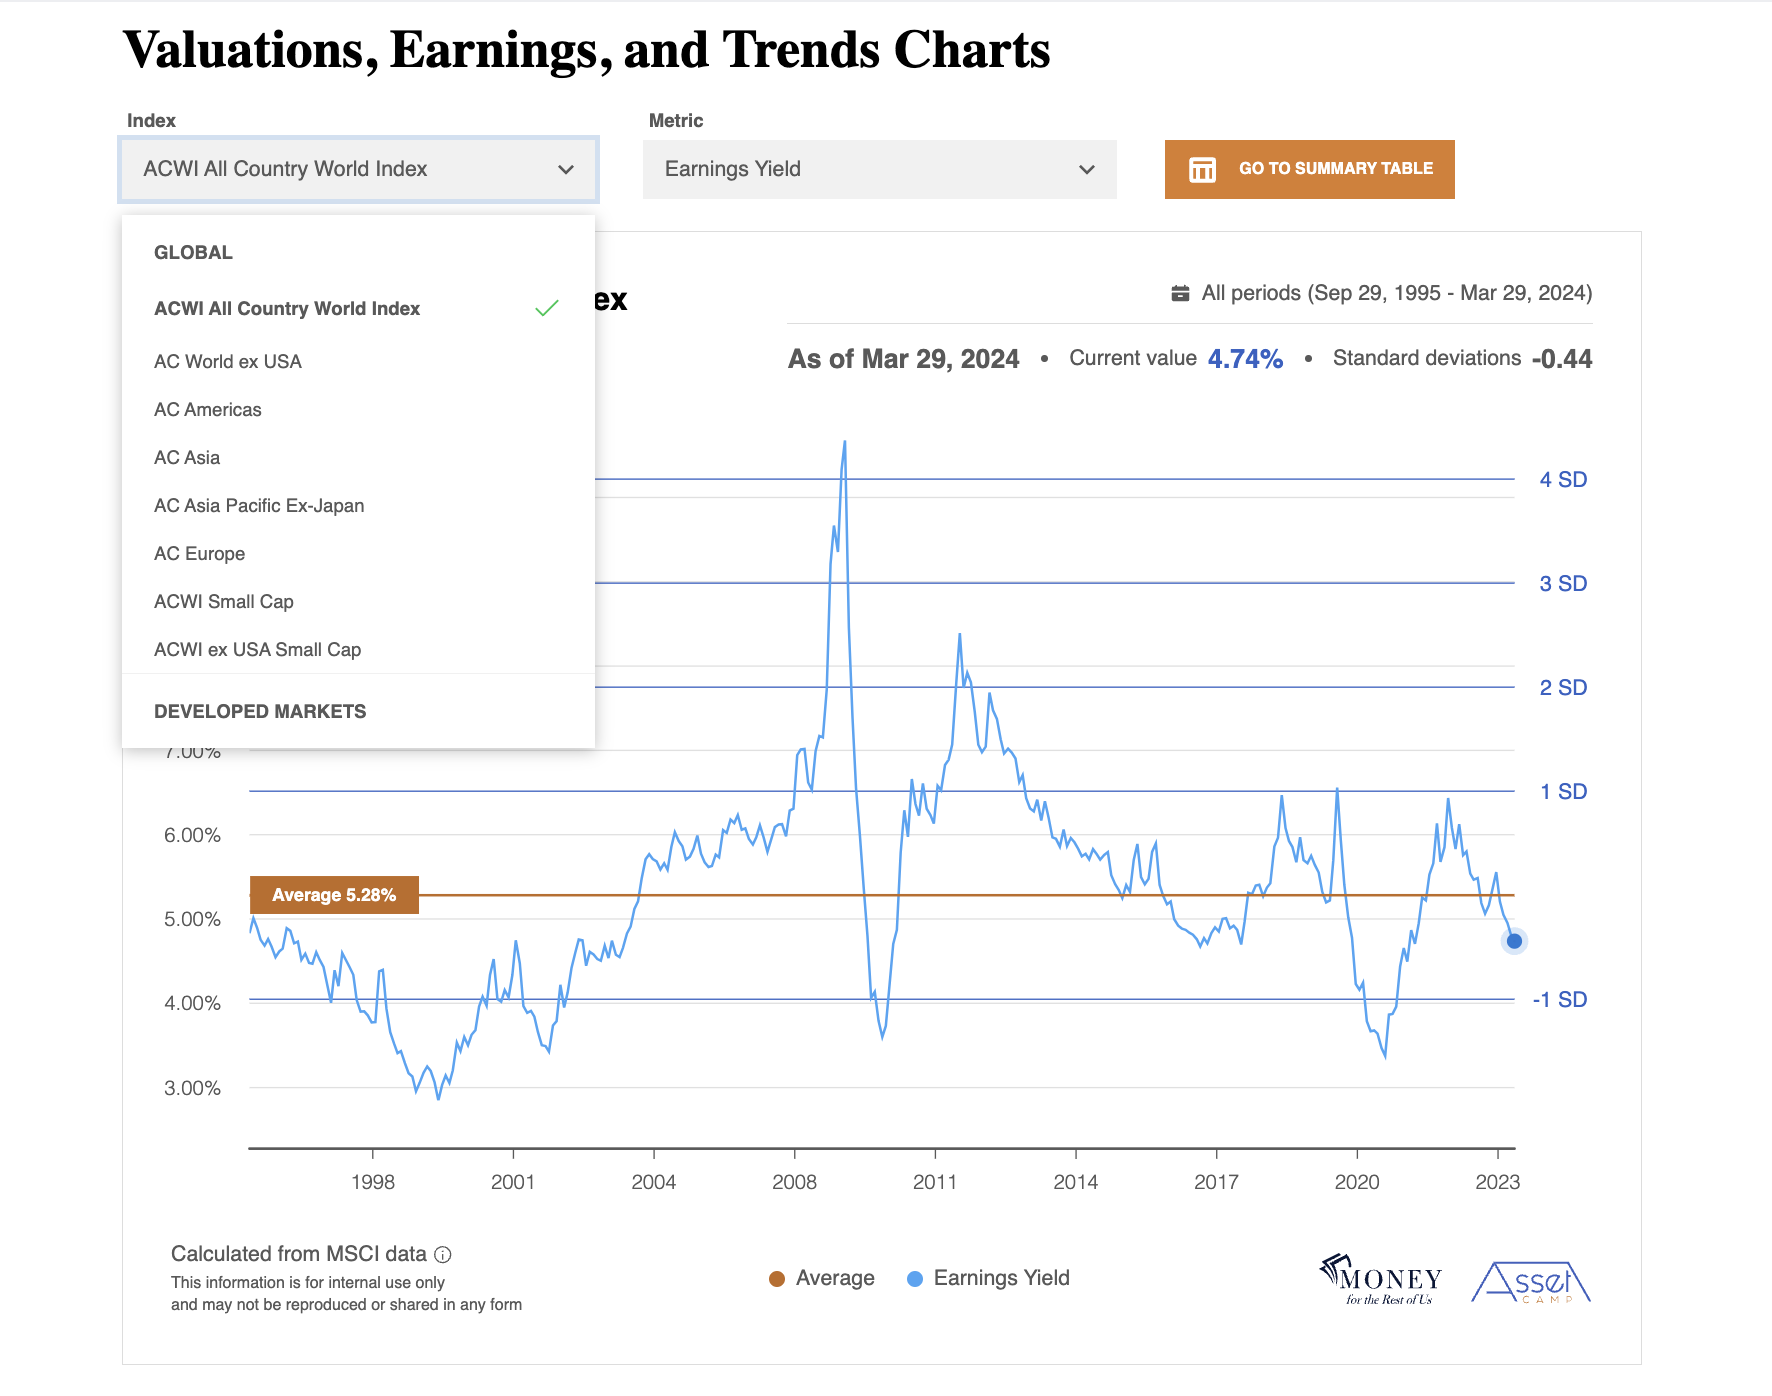
Asset Camp’s Valuations, Earnings, and Trends Charts are the kind of information previously only available to professional investors and fund managers. You can chart all 46 of our metrics across 21 different market metrics. That’s over 900 charts at your disposal to check your work and gain powerful investing insights.

Historical and Current Context
Confidently grasp how now compares to then. No more decisions based on gut feelings or guesswork.
Over or Under Valued?
Compare current stock market metrics to the long-term average and quickly assess new opportunities or looming risks for your portfolio. No more guessing; you can check your work.
Authoritative Understanding
Valuations, Earnings, and Trends Charting is part of the proven investing framework used by professional asset managers, including hedge funds. Now you can unlock this key aspect of wealth building and management.
- Earnings Yield
- Forward Earnings Yield
- Cyclically Adjusted Earnings Yield
- Price-to-Earnings Ratio
- Forward Price-to-Earnings Ratio
- Cyclically Adjusted Price-to-Earnings Ratio
- Price-to-Cash Flow Ratio
- Price-to-Book Value
- Dividend Yield
- Payout Ratio
- 1-Year Trailing Earnings Per Share
- 1-Year Trailing Earnings Per Share Growth
- 1-Year Forward Earnings Per Share Growth
- 5-Year Historical Earnings Per Share Growth
- 5-Year Historical Sales Per Share Growth
- Long-Term Forward Earnings Per Share Growth (3 to 5 Years)
- Return on Equity
- 3-Month Moving Average – USD
- 3-Month Moving Average – Local Currency
- 10-Month Moving Average – USD
- 10-Month Moving Average – Local Currency
21 Essential Metrics
Empower your investing like never before with 21 key stock market metrics, including ten valuation views, six earnings views, four trend views, and more.

Current and Historical View
Isolate a valuation or earning metric at any point in time. See how right now compares to the long-term average and confidently make decisions about investment opportunities and risk.

Chart Your Way Across 99% of the Market
We have charts for each of our indexes, based on data going back to the index’s inception date, giving you the most comprehensive snapshot of index performance ever available to individual investors.
Ready to take your next step?
Act on the same data as the professionals.
