Past Performance Simplified: Sharpen Your Overall Understanding Of What Happened
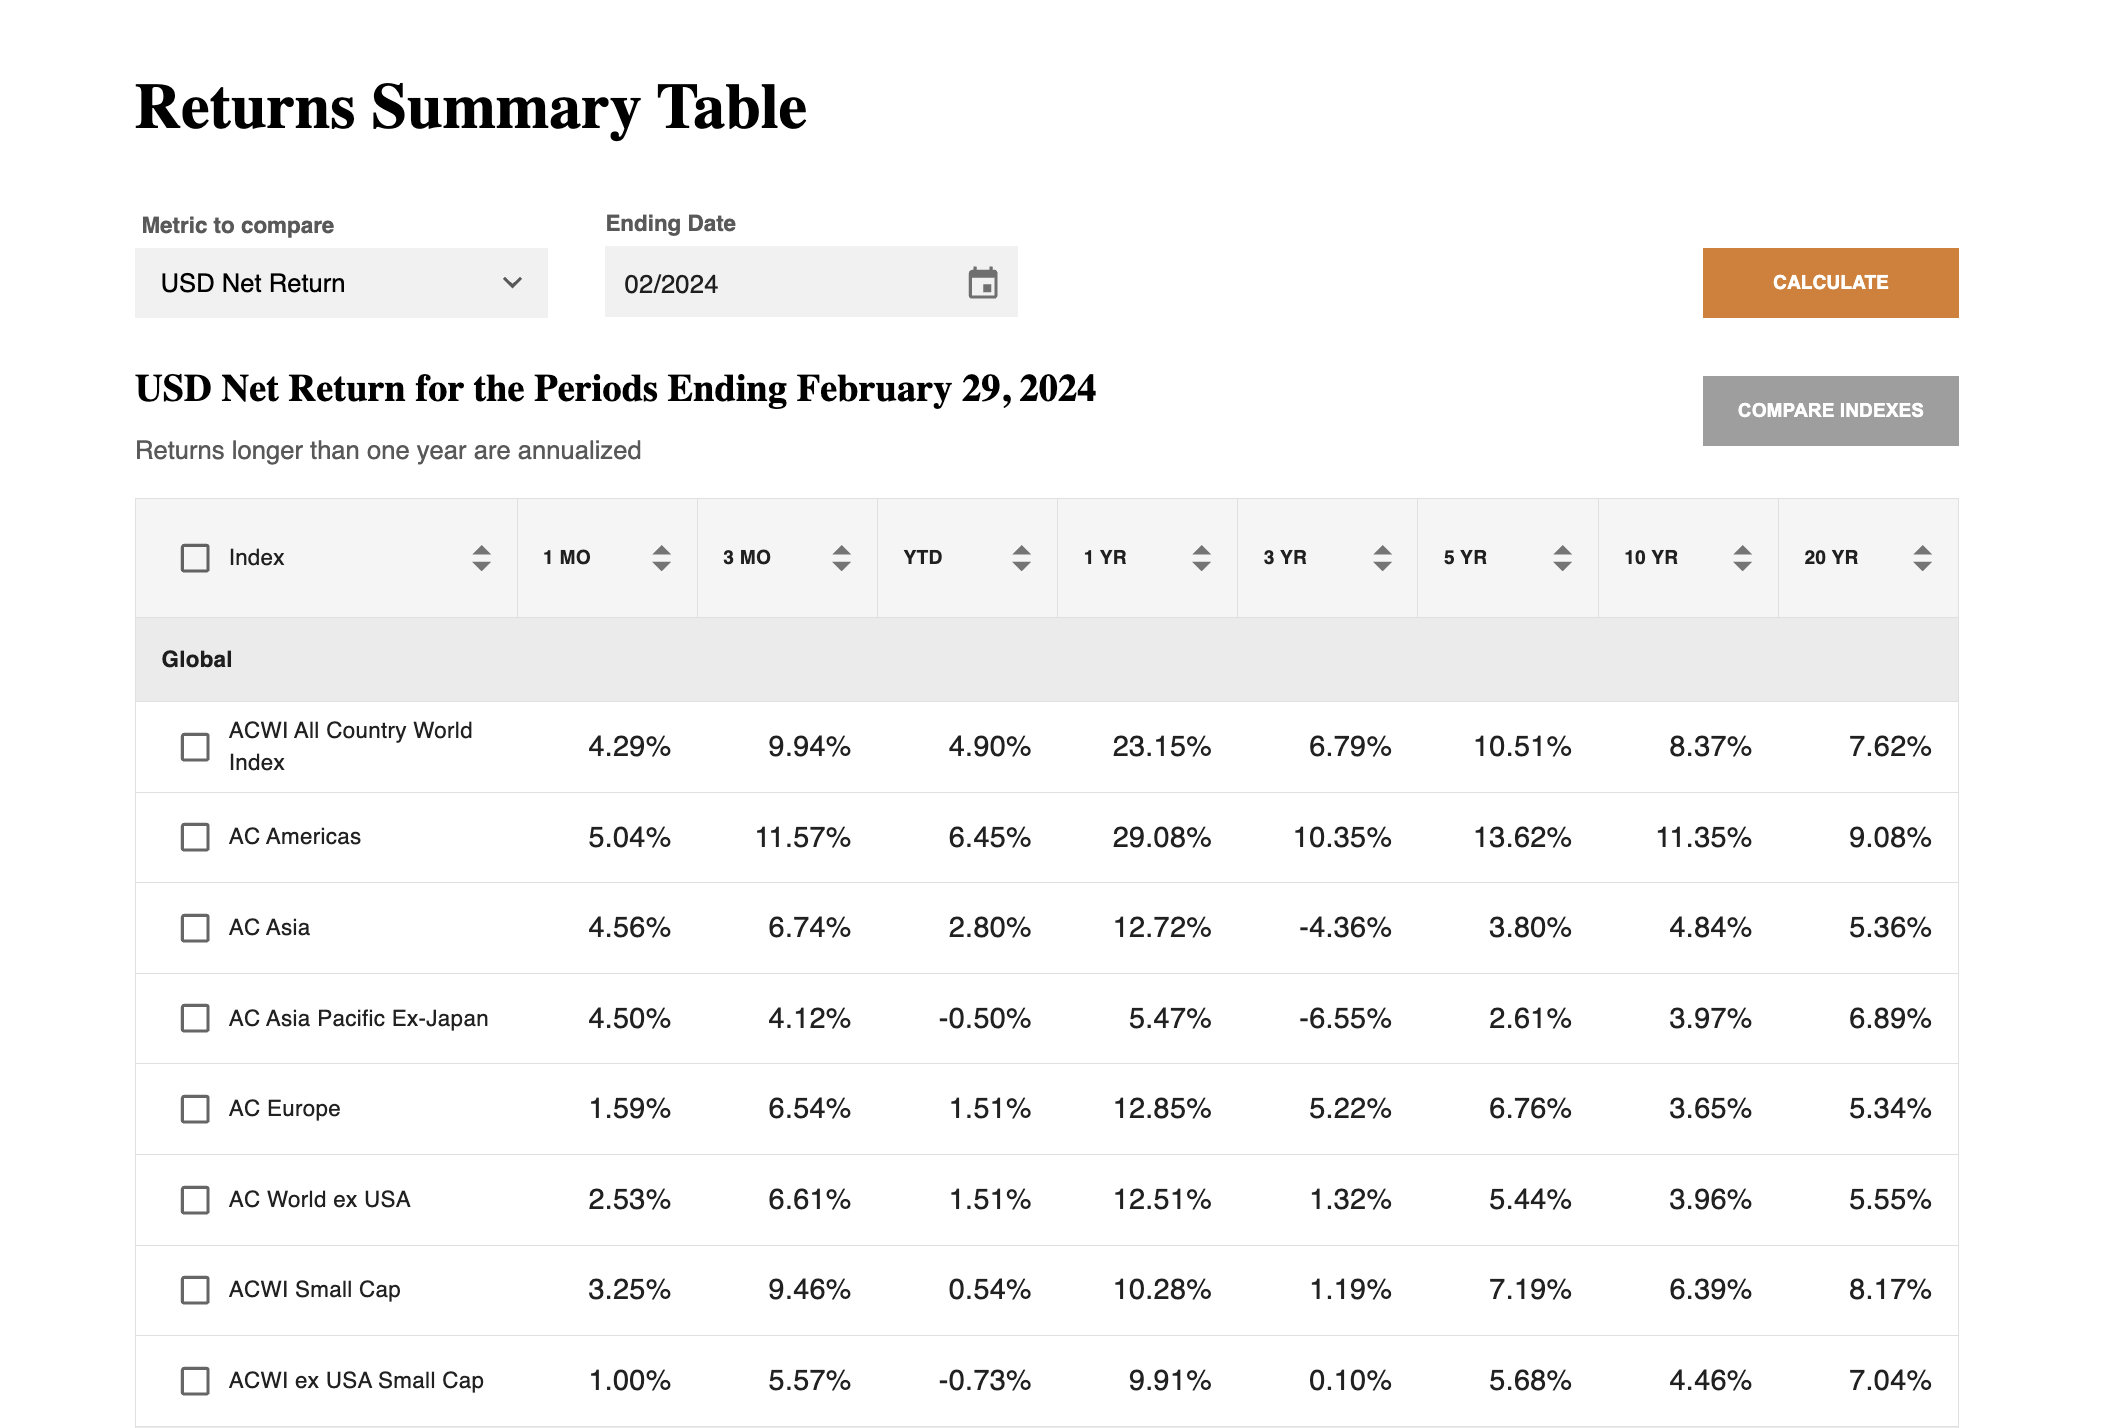
Asset Camp’s Stock Market Returns Summary Table lets you compare and rank our 46 stock indexes by short-term and long-term performance using various return types and standardized time periods. Now you have an even bigger picture idea on how the stock market has performed.

The Perfect Starting Point
Get performance clues to where there are opportunities and risks before using our other tools. Start simple, then go deep.
A Link to the Past
Learn to understand the importance of how long-term and short-term performance are connected.

See the Direct Impact of Currencies and Dividends on Performance
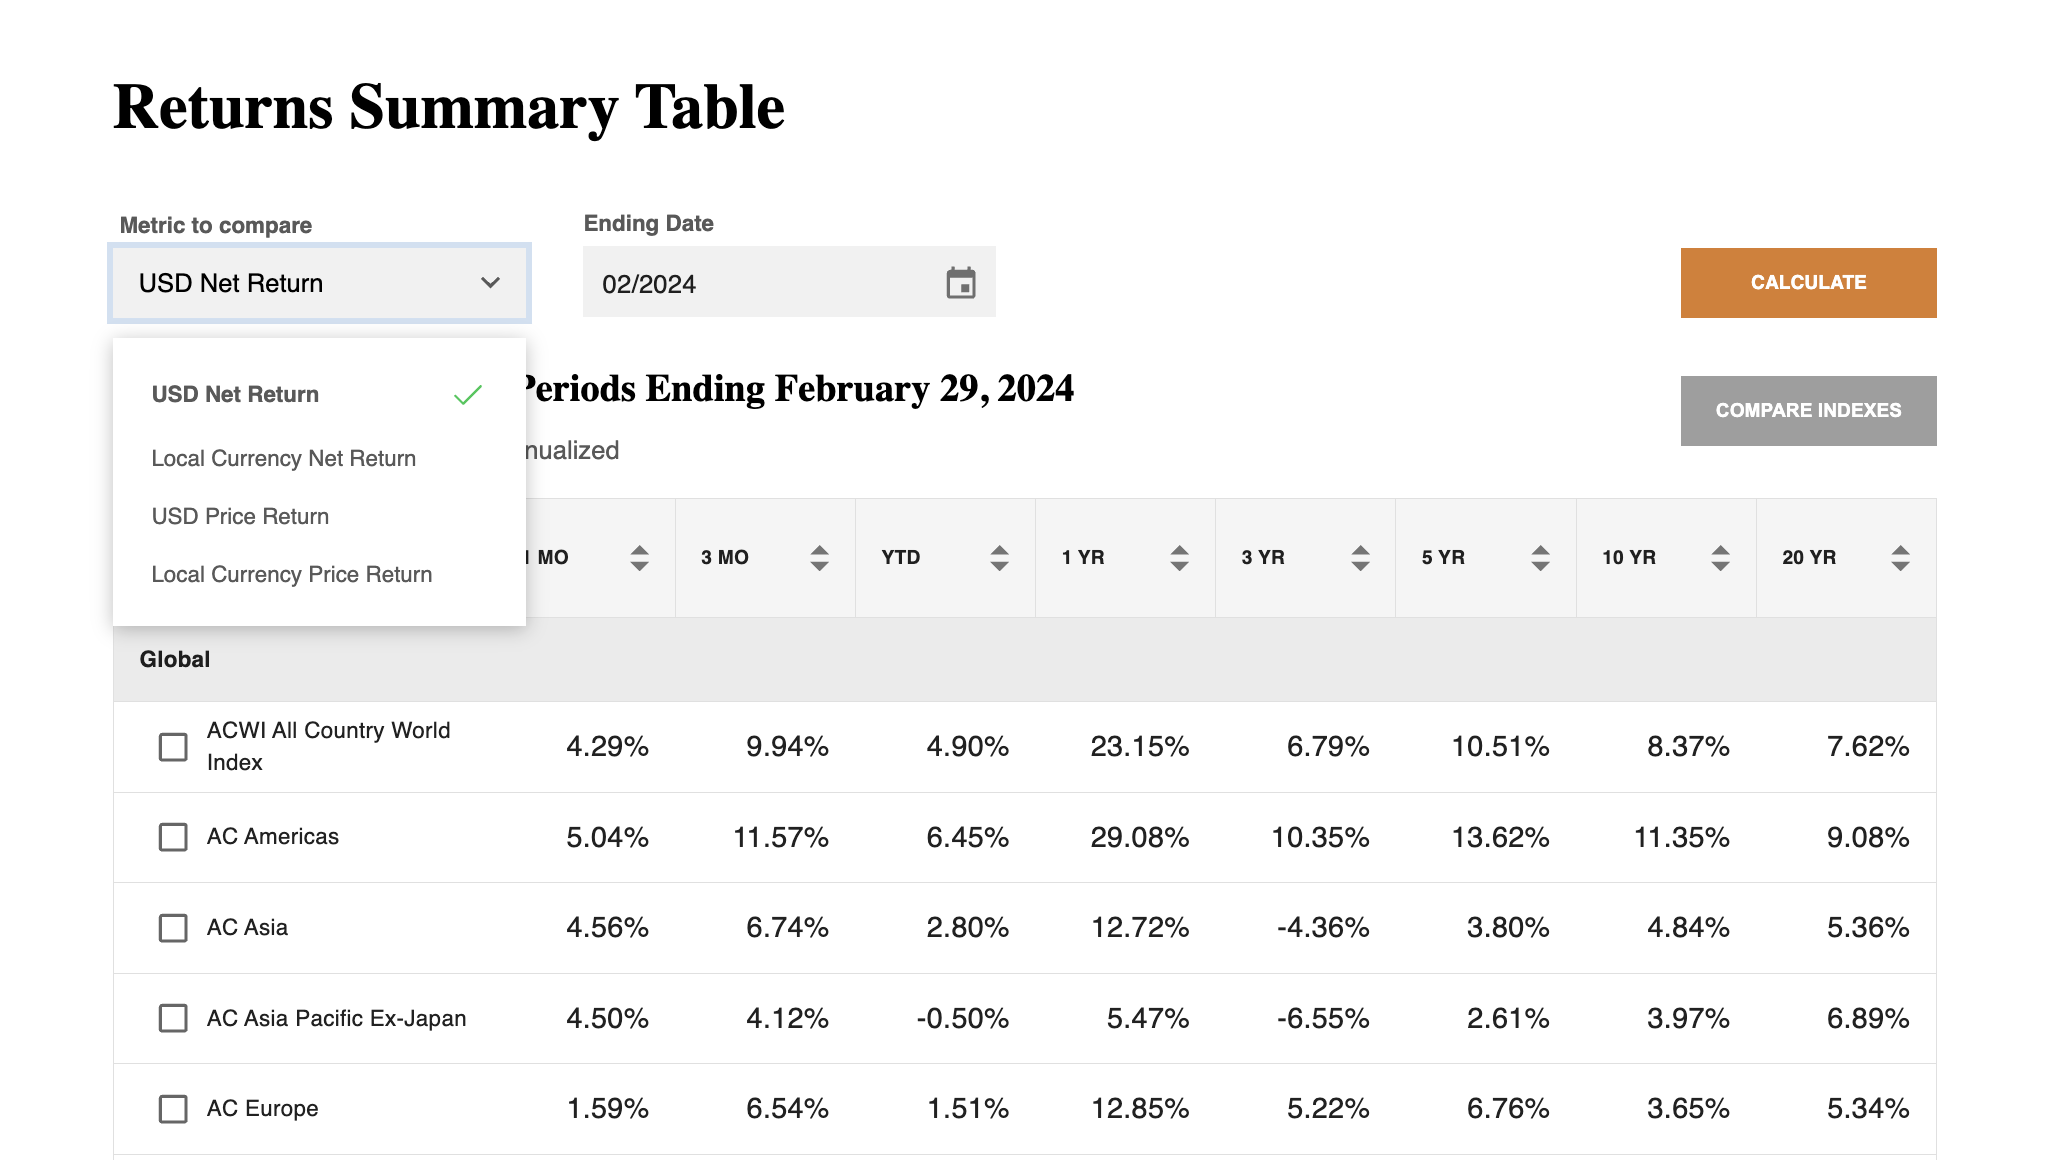
Clearly compare the outcomes of U.S. dollar returns compared to the indexes’ local currencies.
Also compare net returns that include dividends with price returns that exclude dividends.

Focus on Chosen Time Periods
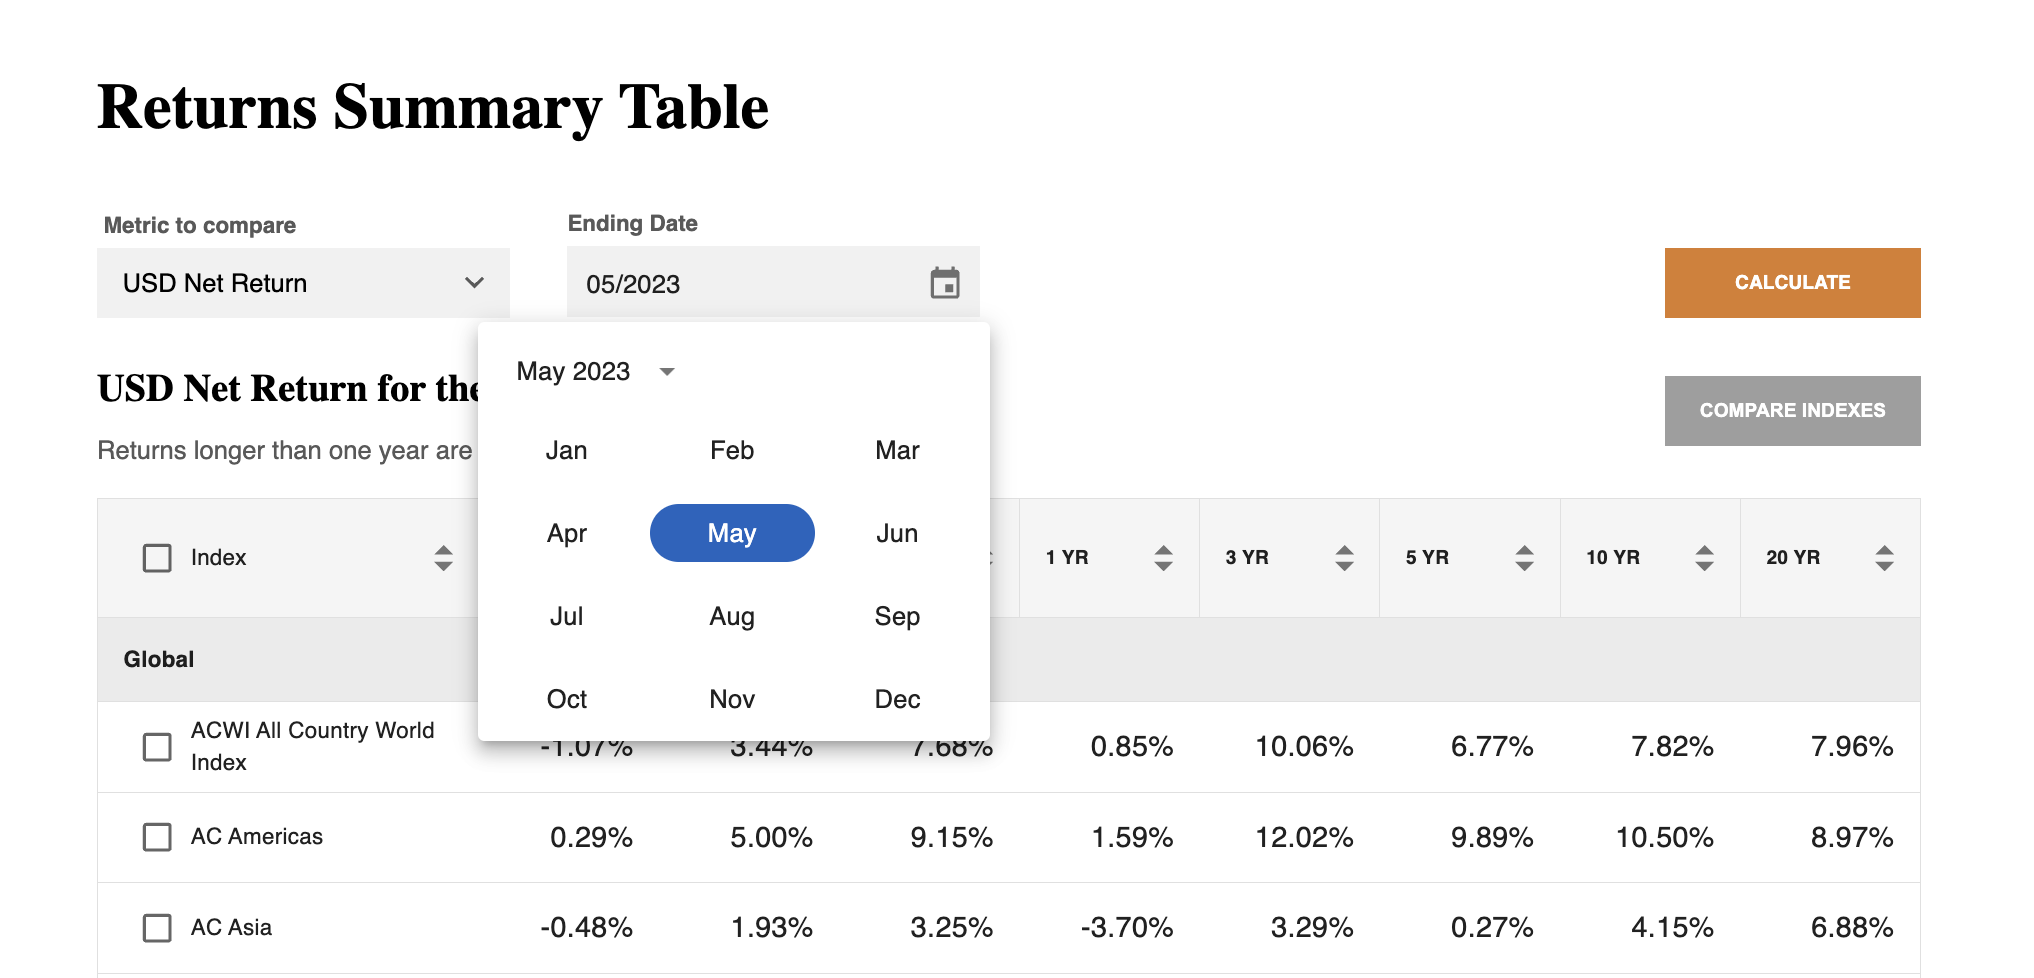
See an index’s return over standardized periods of 1 month, 3 months, YTD, 1, 3, 5, 10, and 20 years. Choose different ending periods to gain insightful snapshots of historical performance.

Rank and Compare
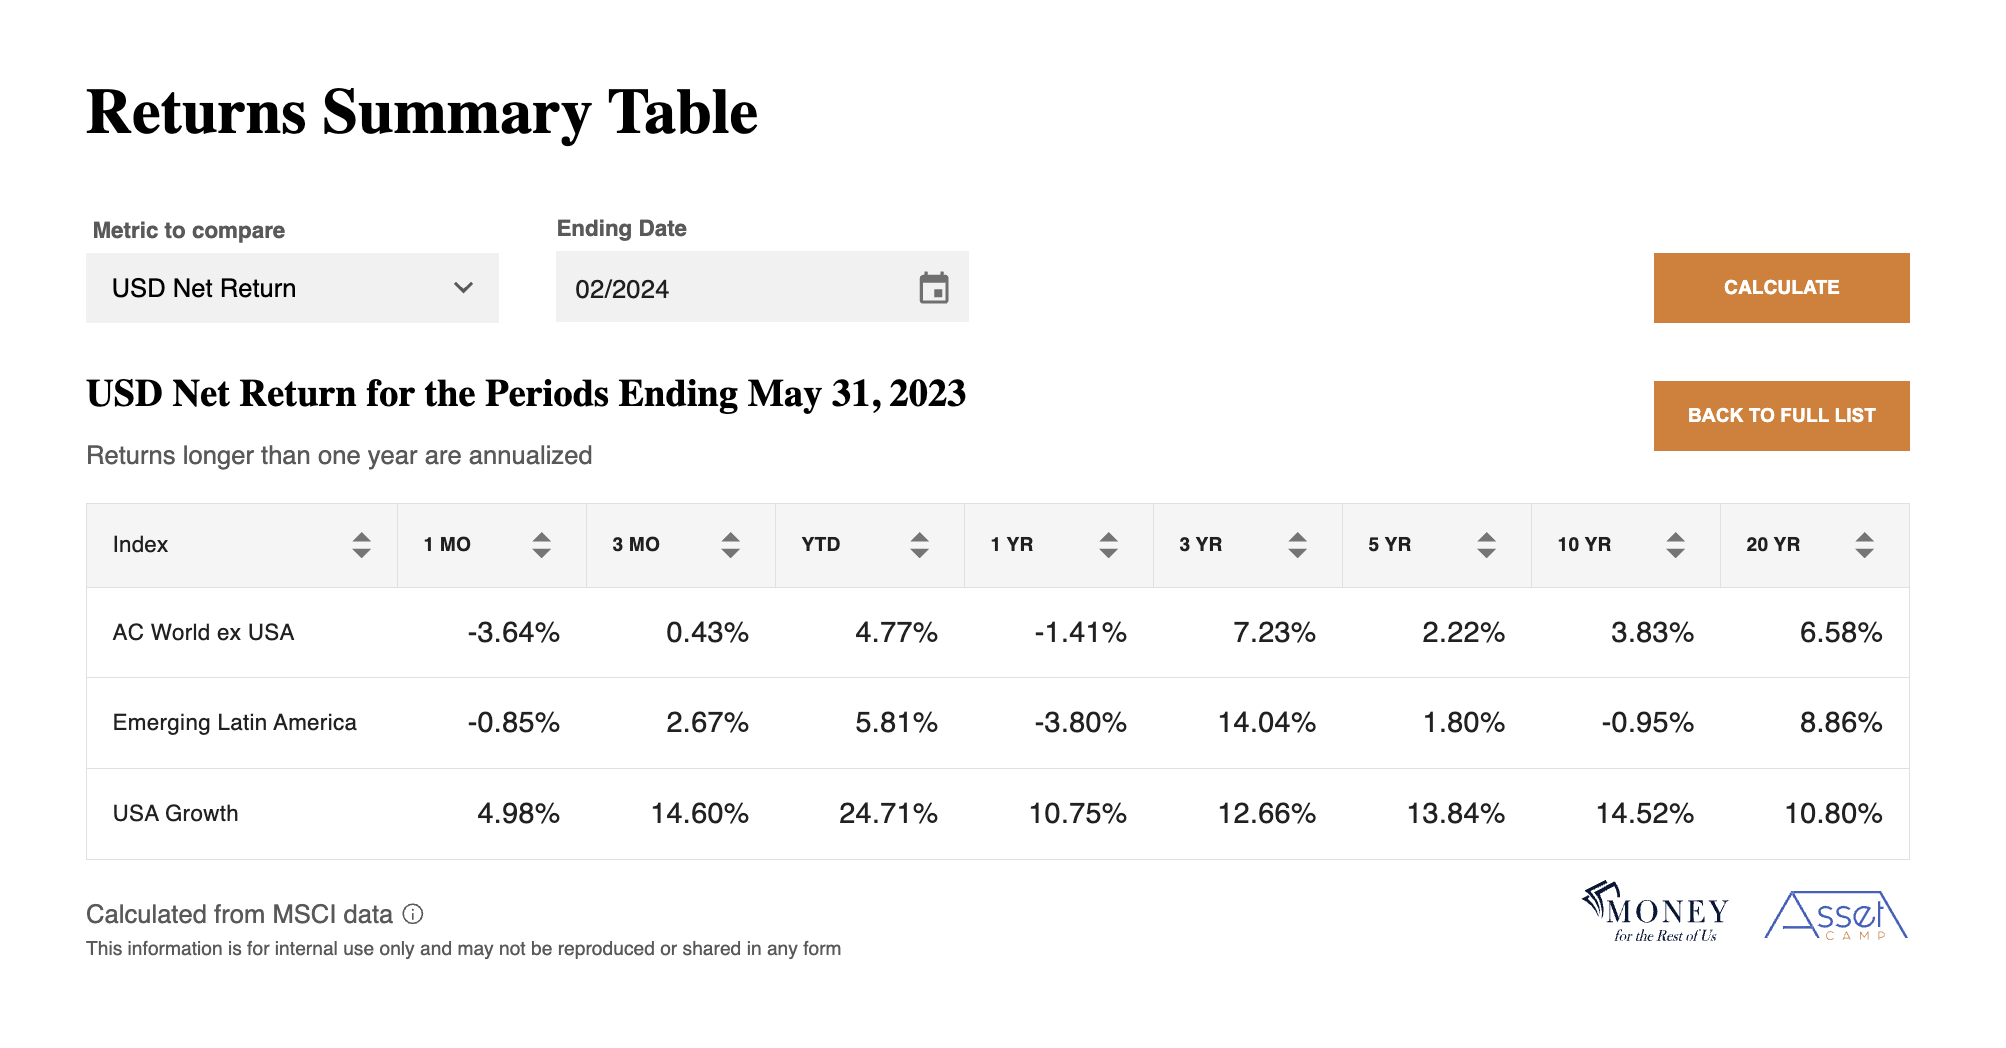
Rank index performance by each standardized time period, or compare only the indexes you care most about.
Ready to take your next step?
Act on the same data as the professionals.
